


Infographic Designs
Infographics are a visually appealing way to present complex data – encouraging greater engagement and information retention. Branded and bespoke infographics can help tell your story, position your business as an authority and hence build trust. Infographics are ideally suited to social media and they’re great for SEO – image-rich content generates more views than content without. Engaging, thoughtfully designed infographics can;
– Break down complex processes into clear visual steps.
– Showcase data in an accessible, engaging format.
– Summarize information in quick-reference visual guides.
– Compare product features side by side.
– Highly shareable format maximises brand exposure
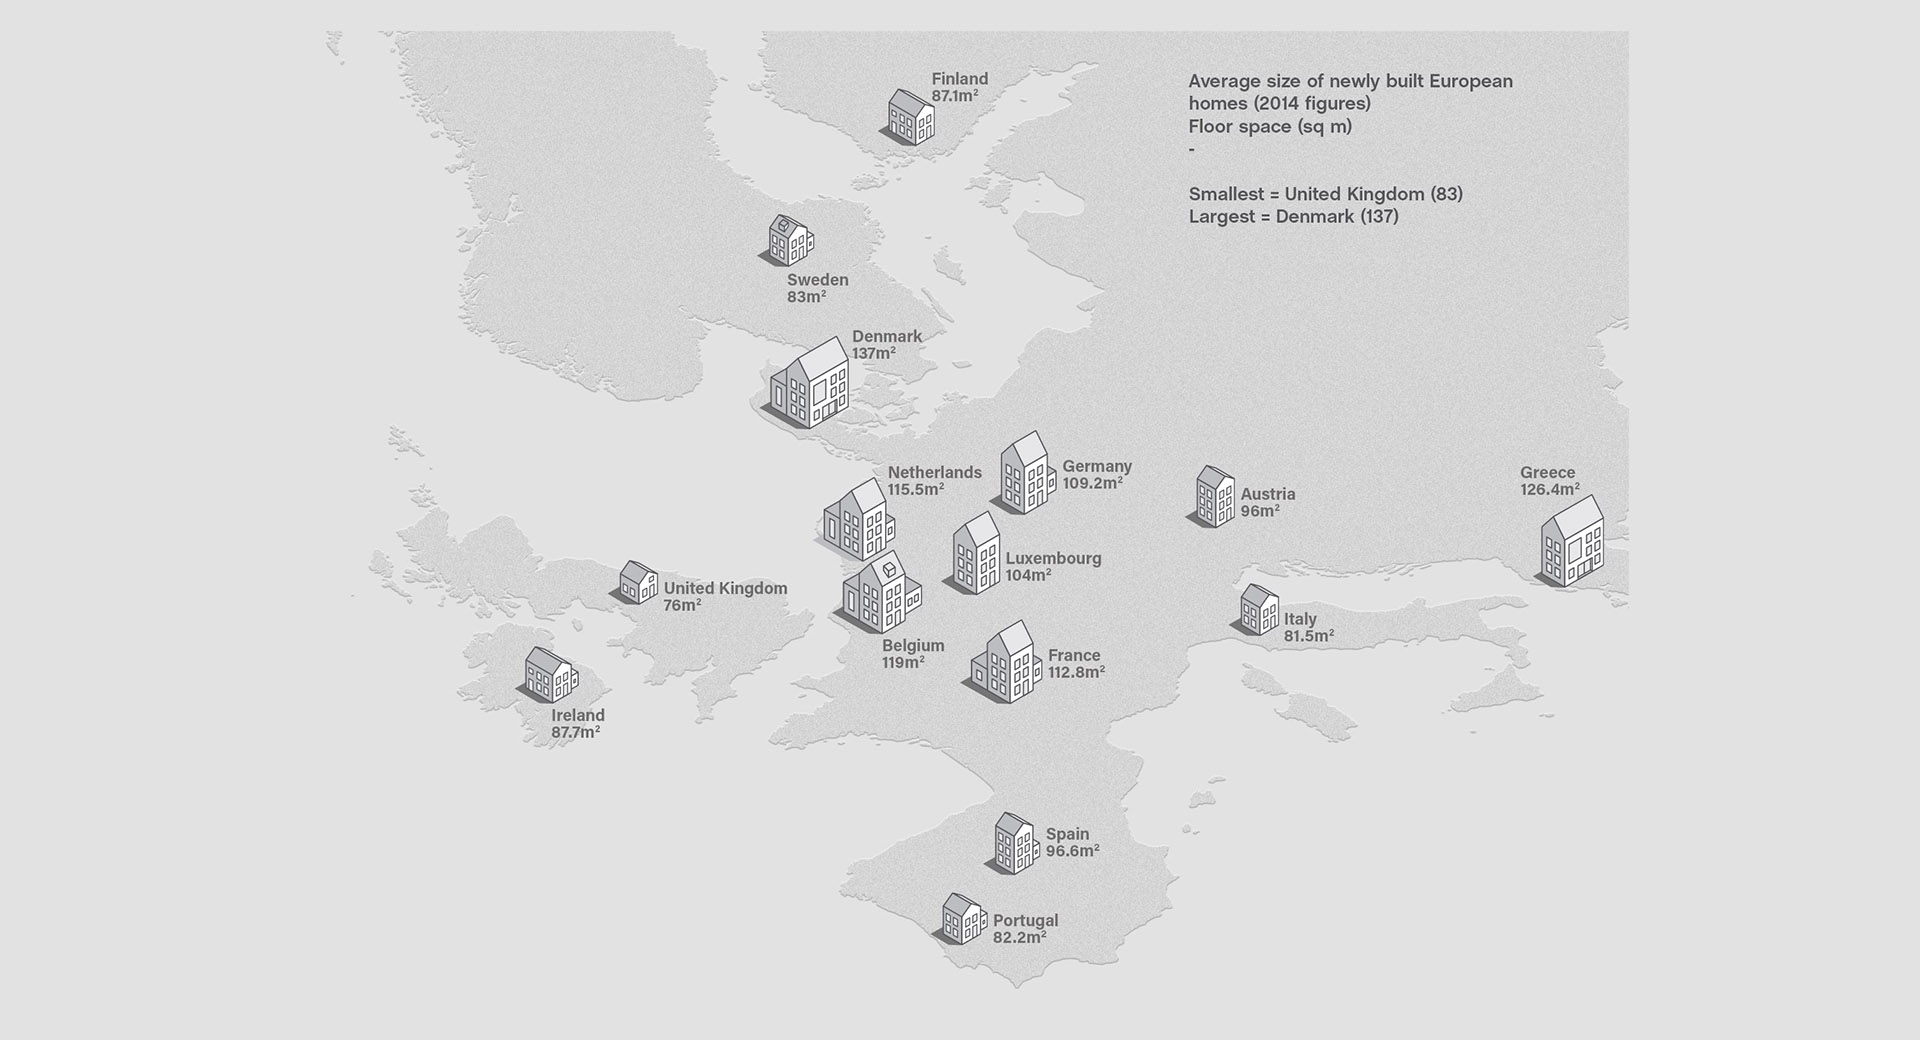
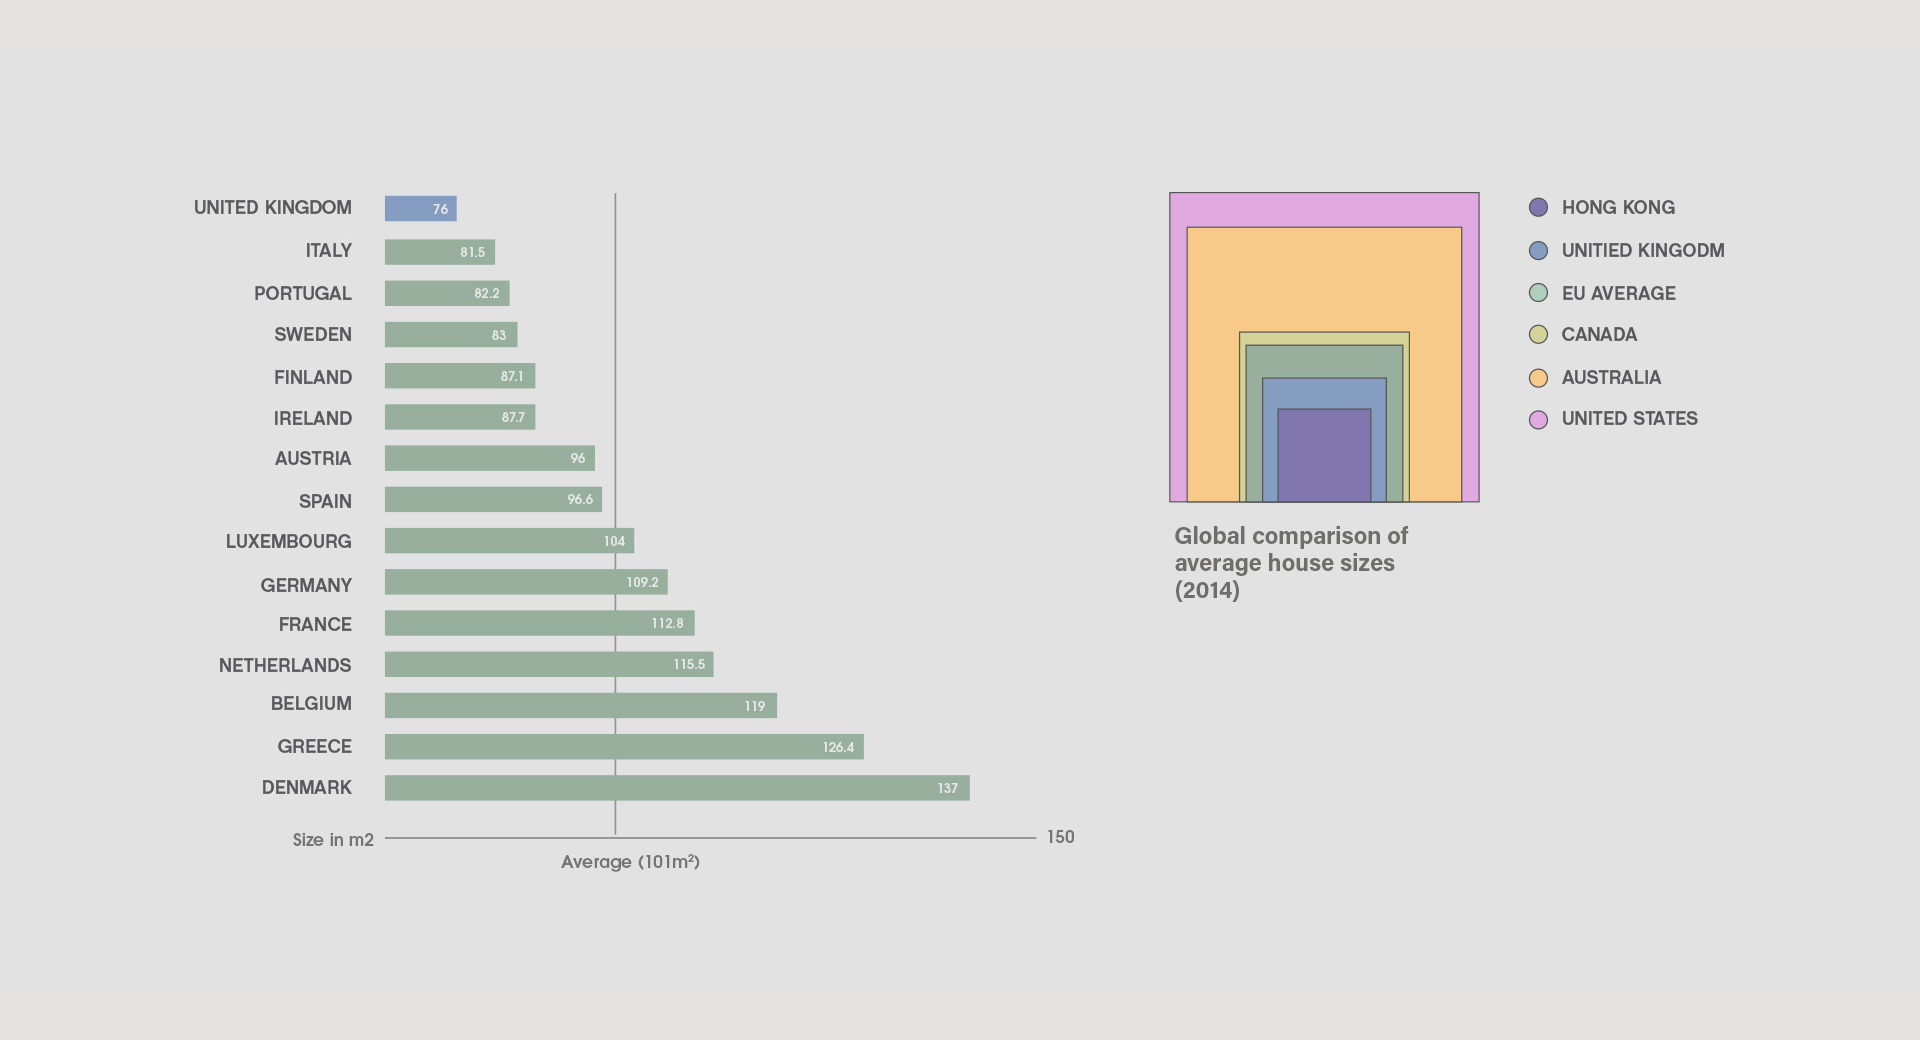
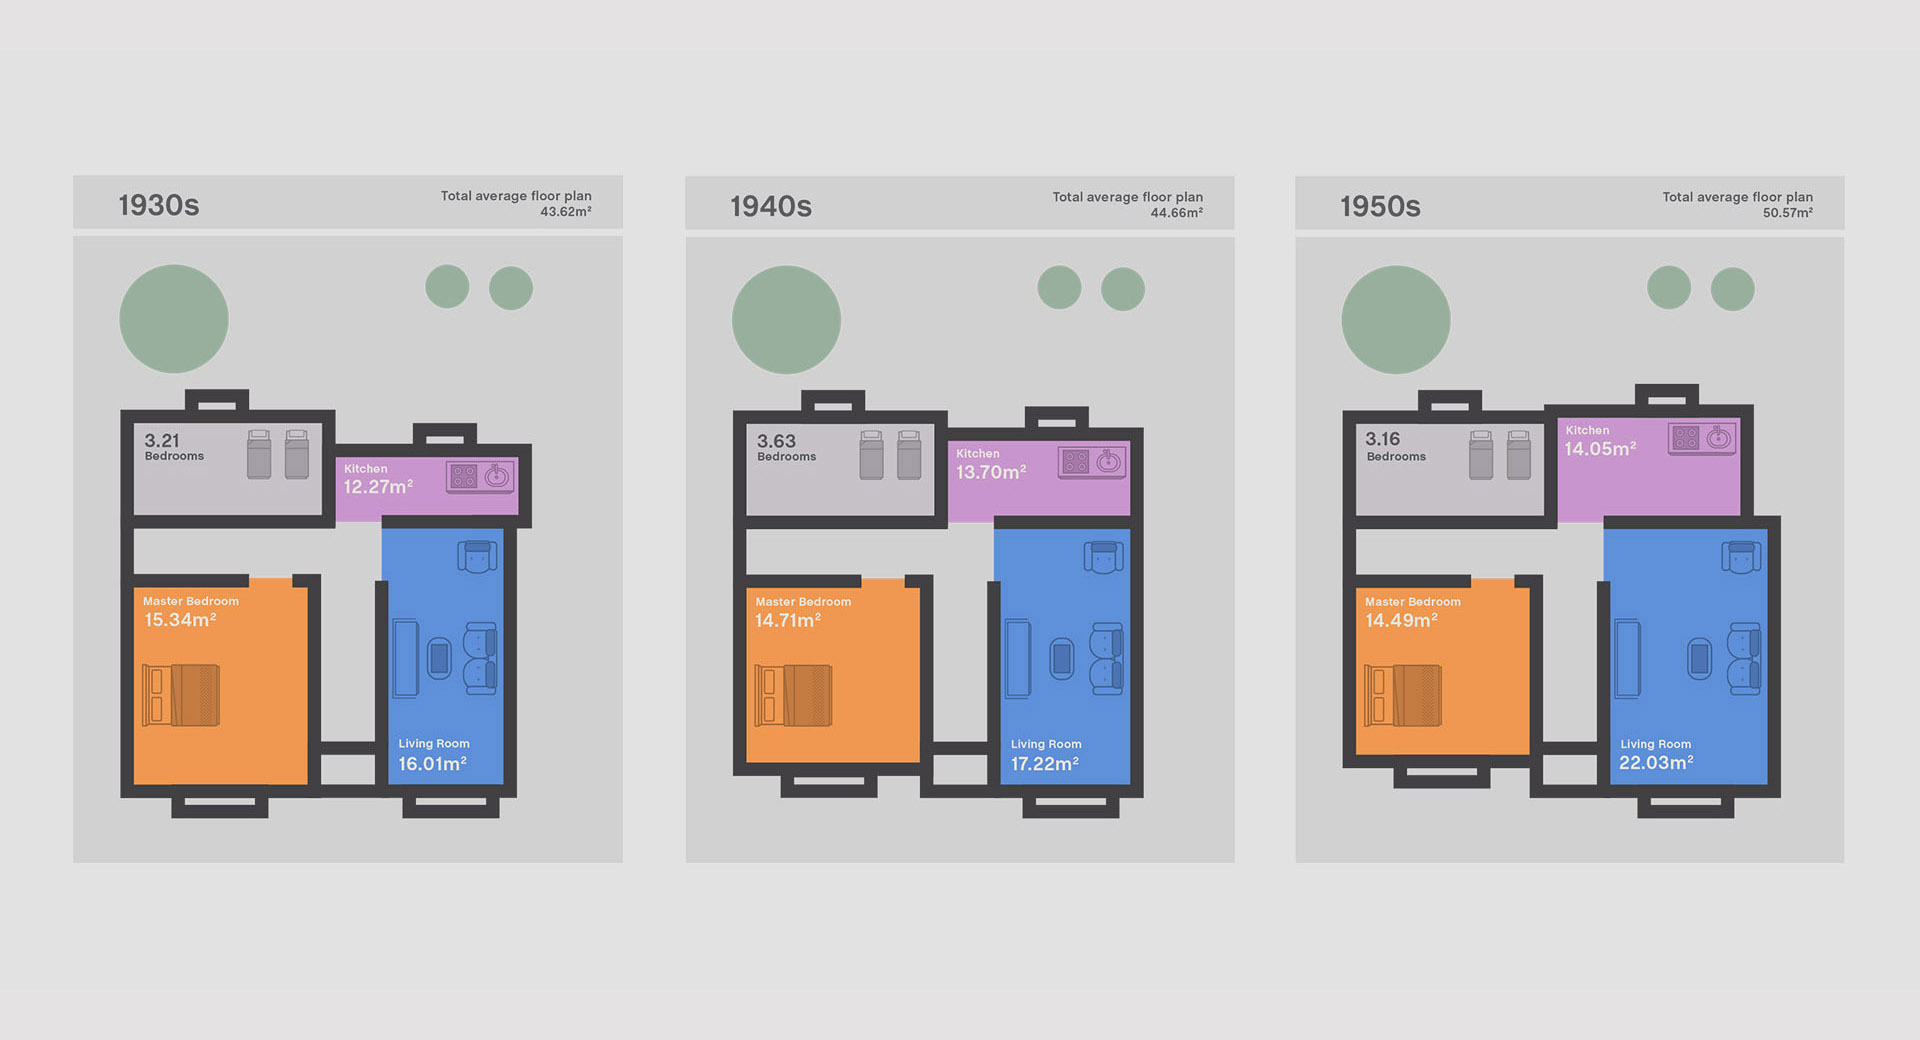
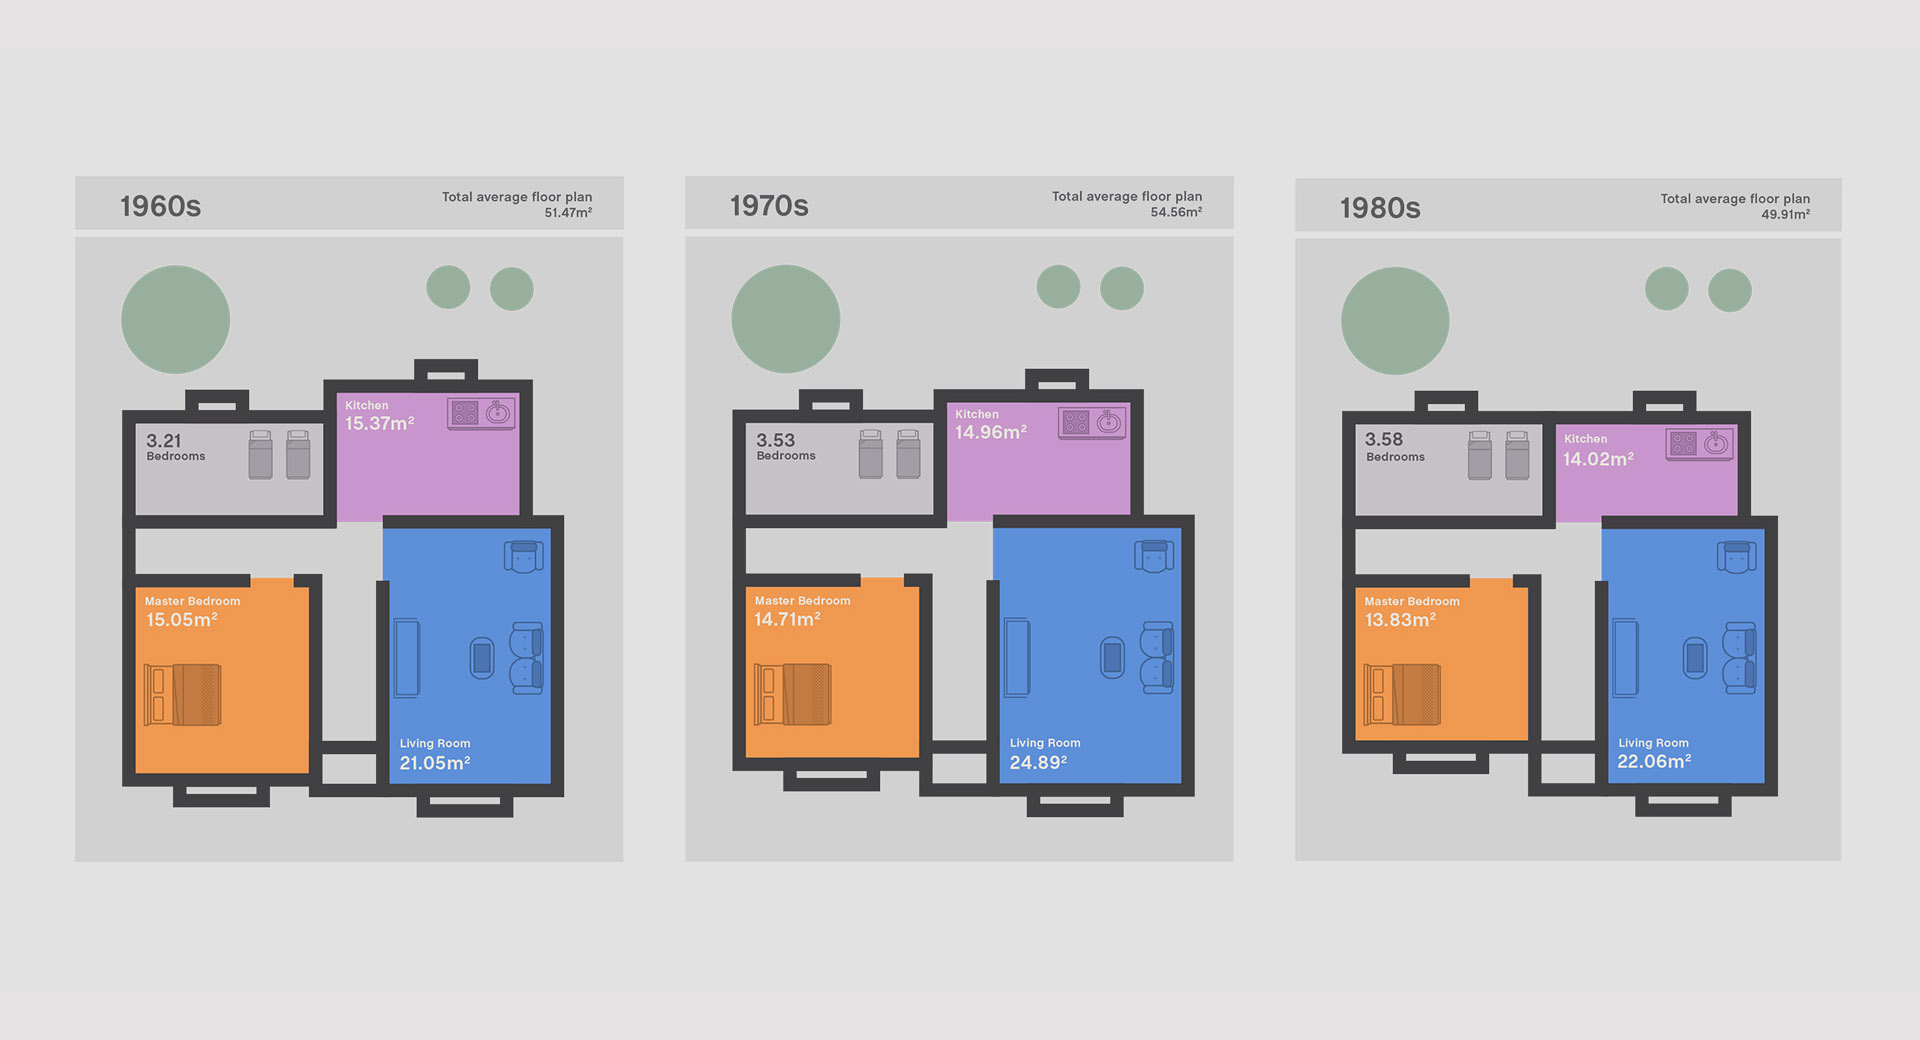
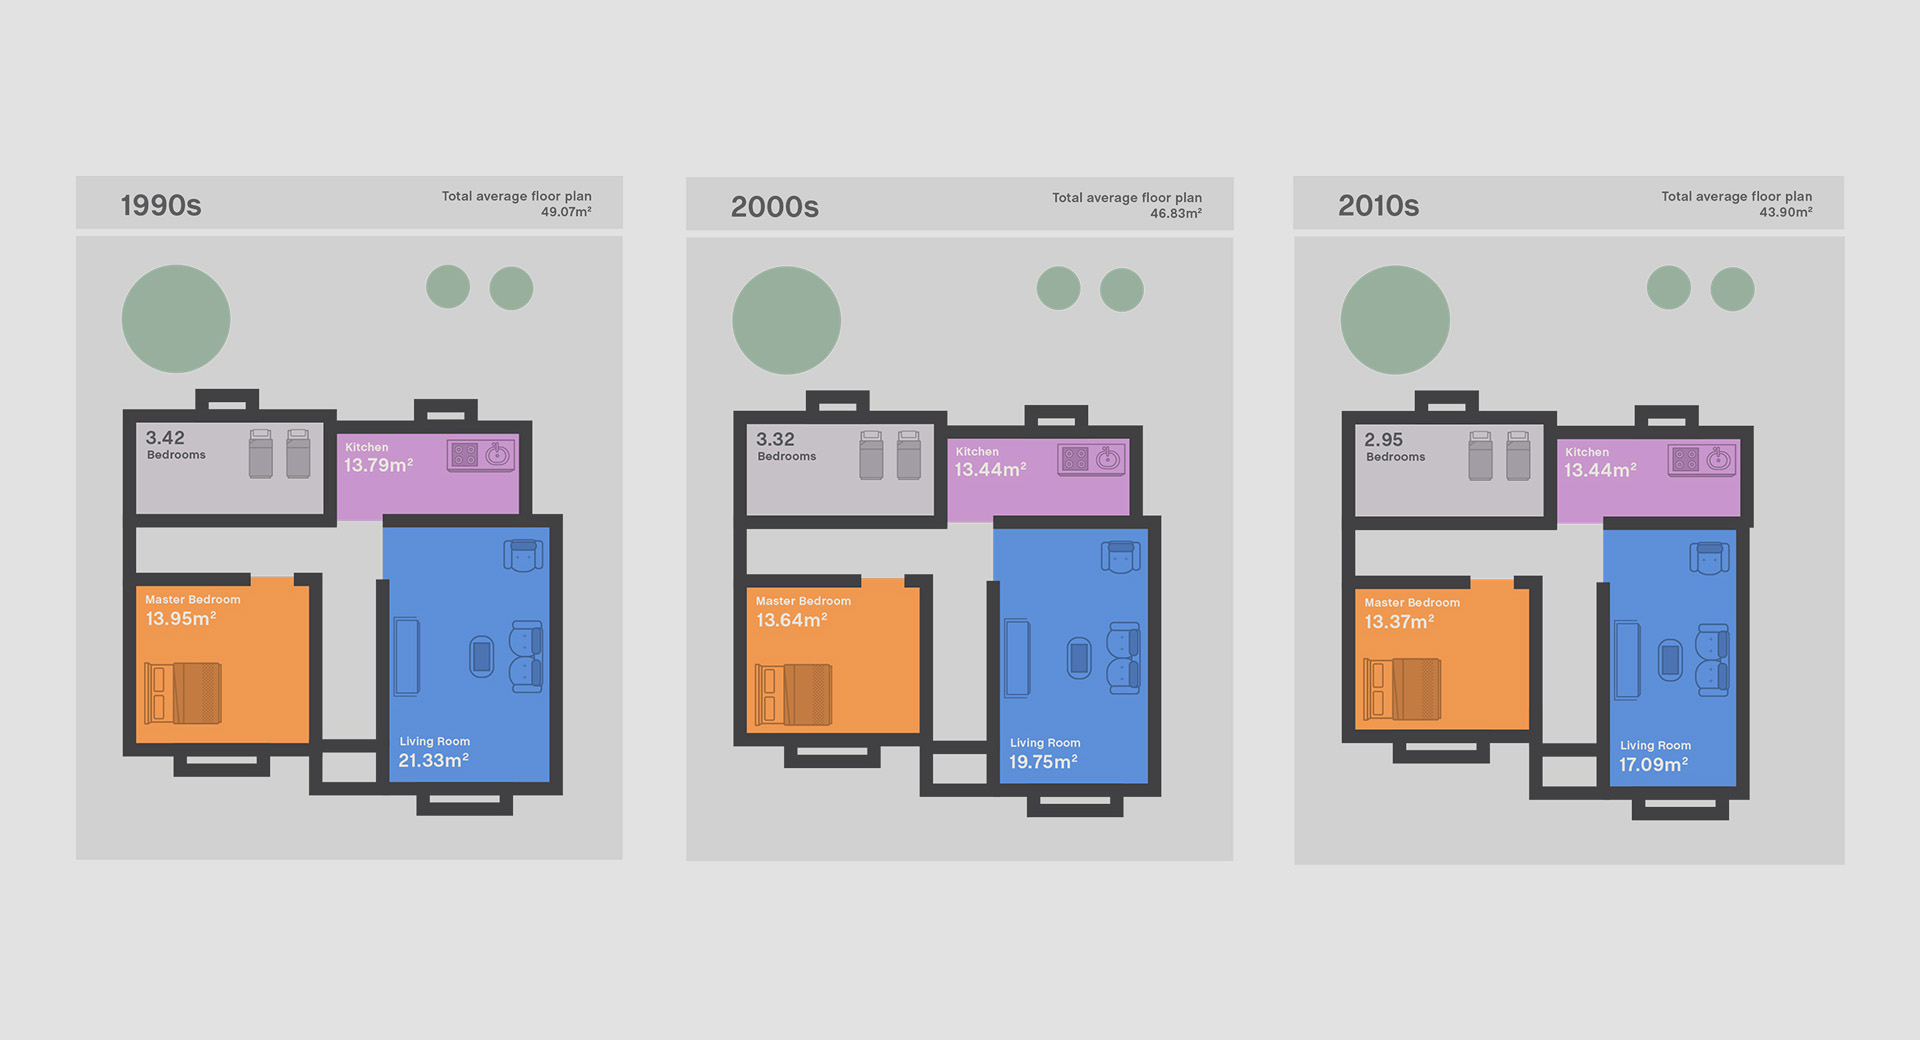
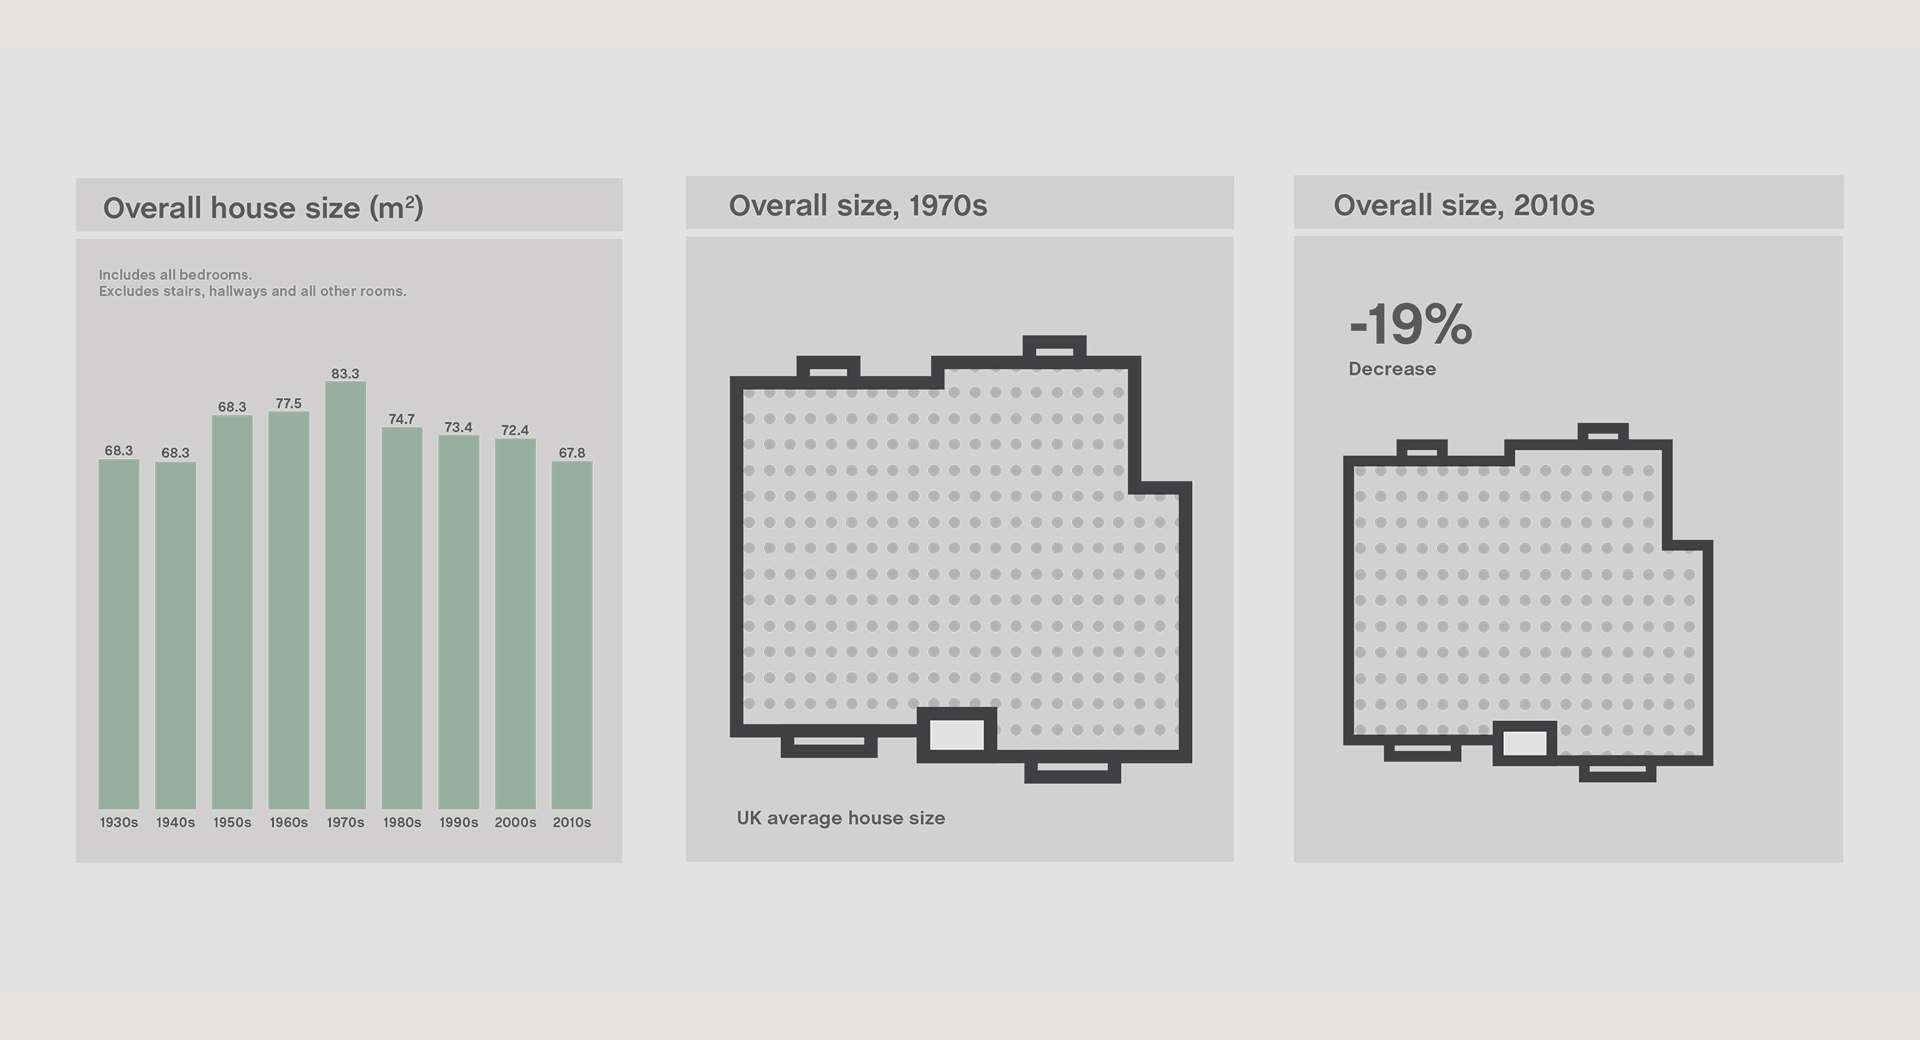
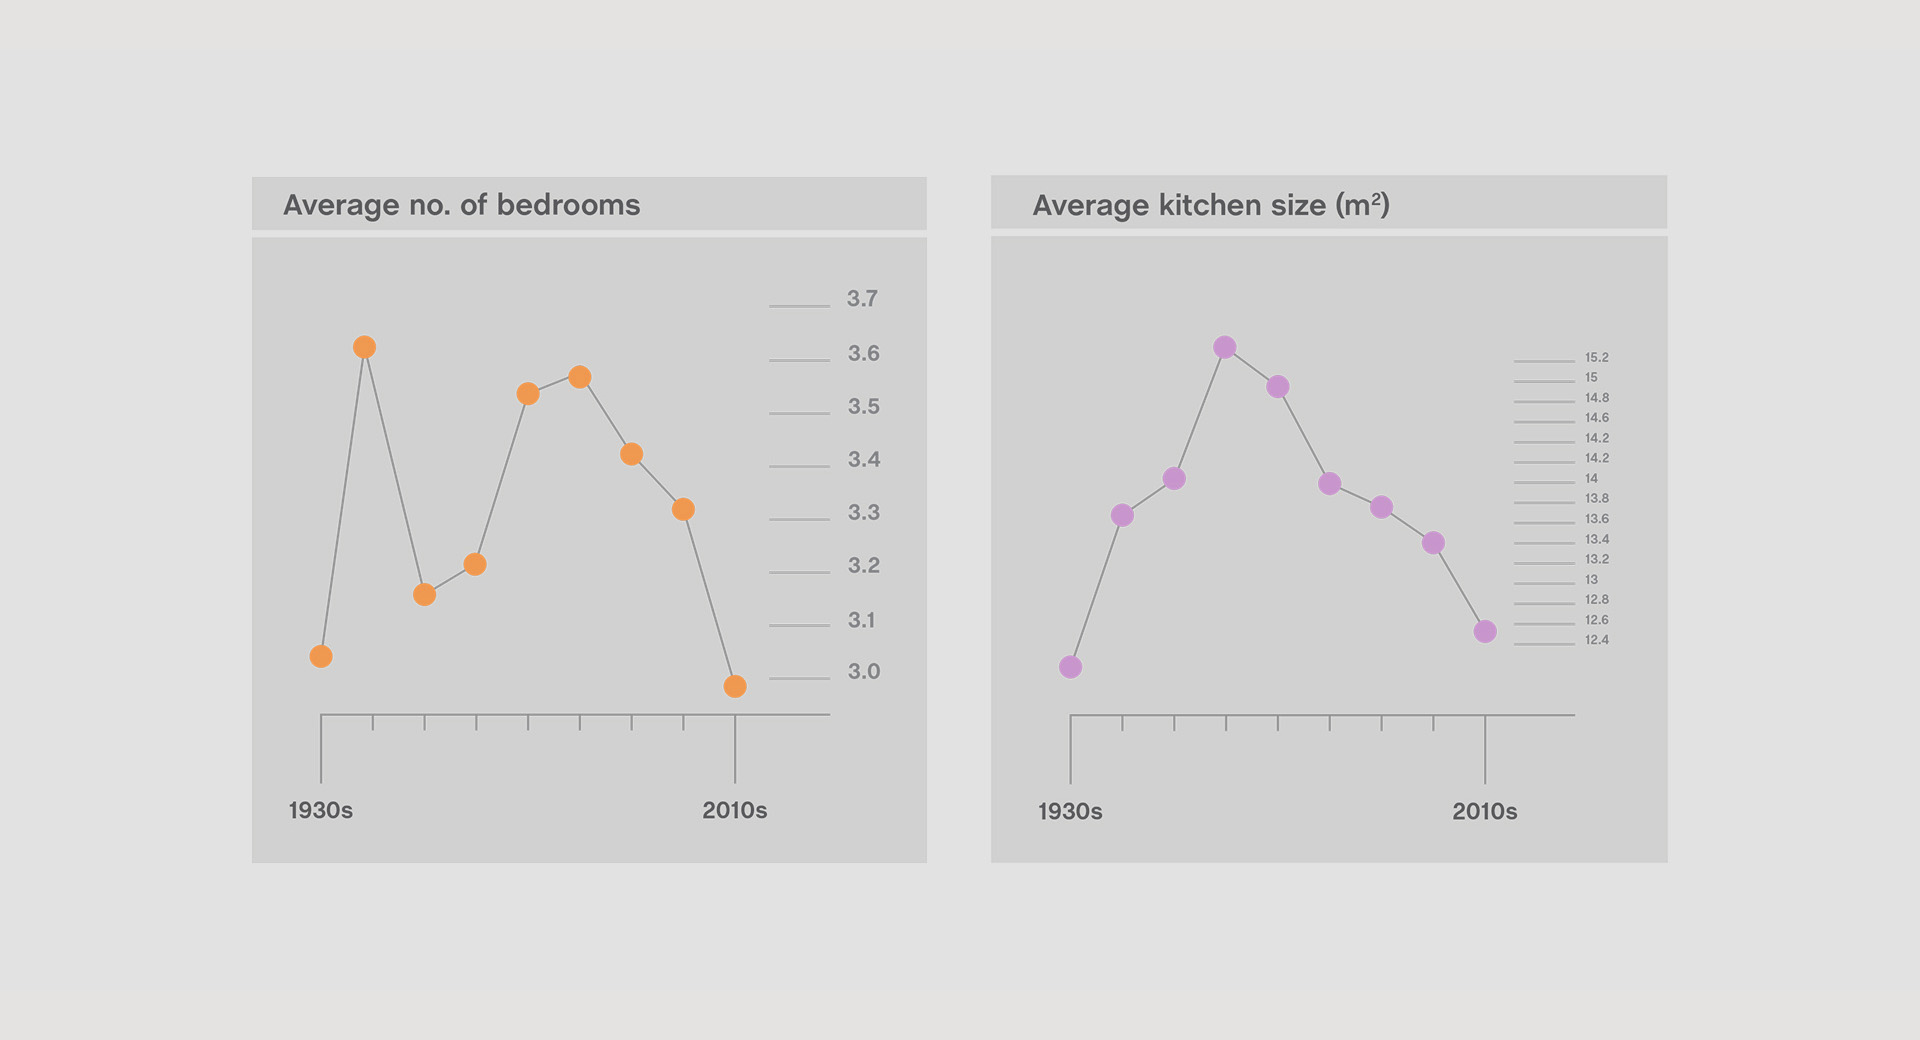
The UK’s Housing Squeeze
Project Info
The UK builds, on average, the smallest new homes in western Europe. Research conducted by Cambridge University found that the UK finished bottom of a list of 15 major EU countries. The graphics below show a comparative representation of the average new-build house size and how the UK compares to the European average, and to other countries around the world.
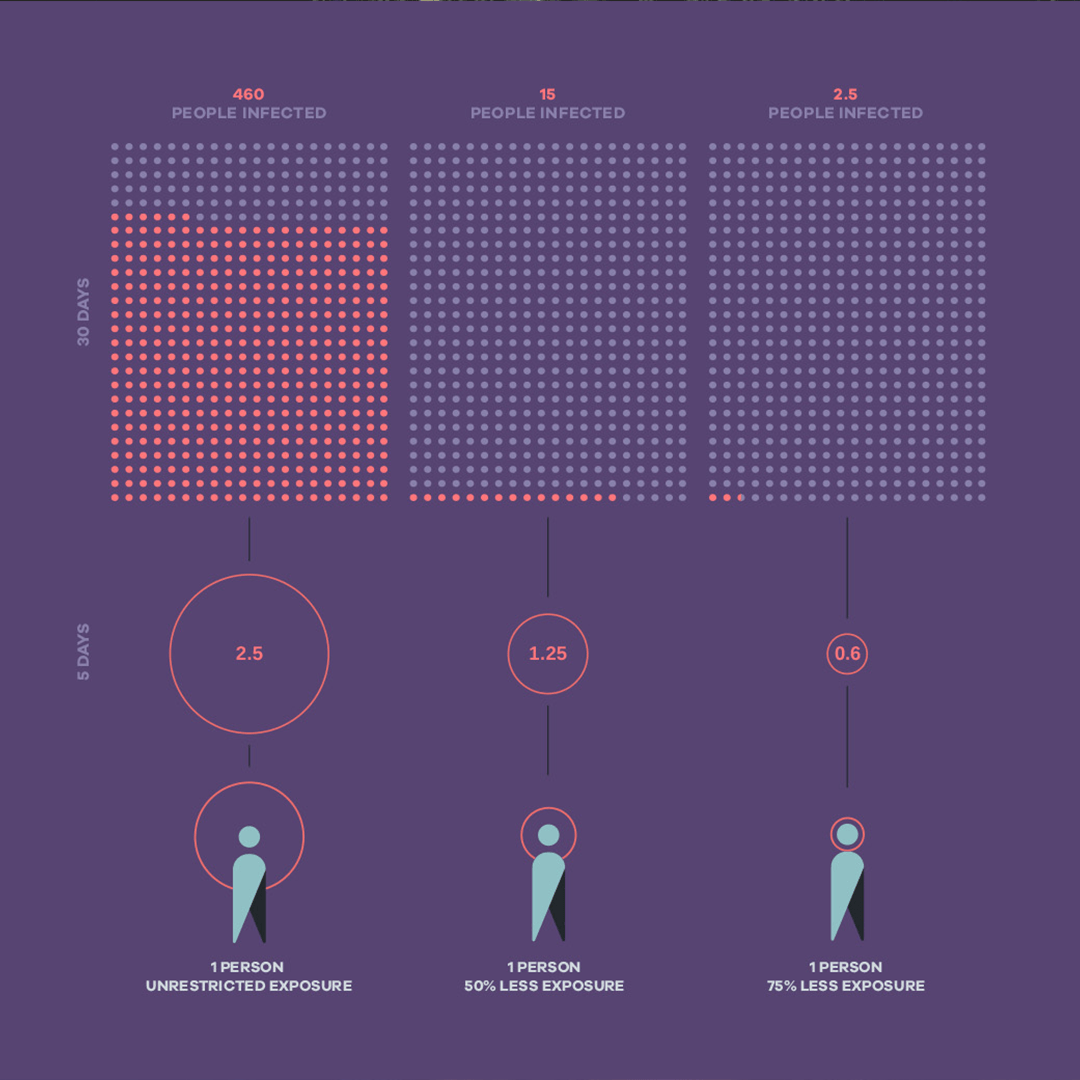
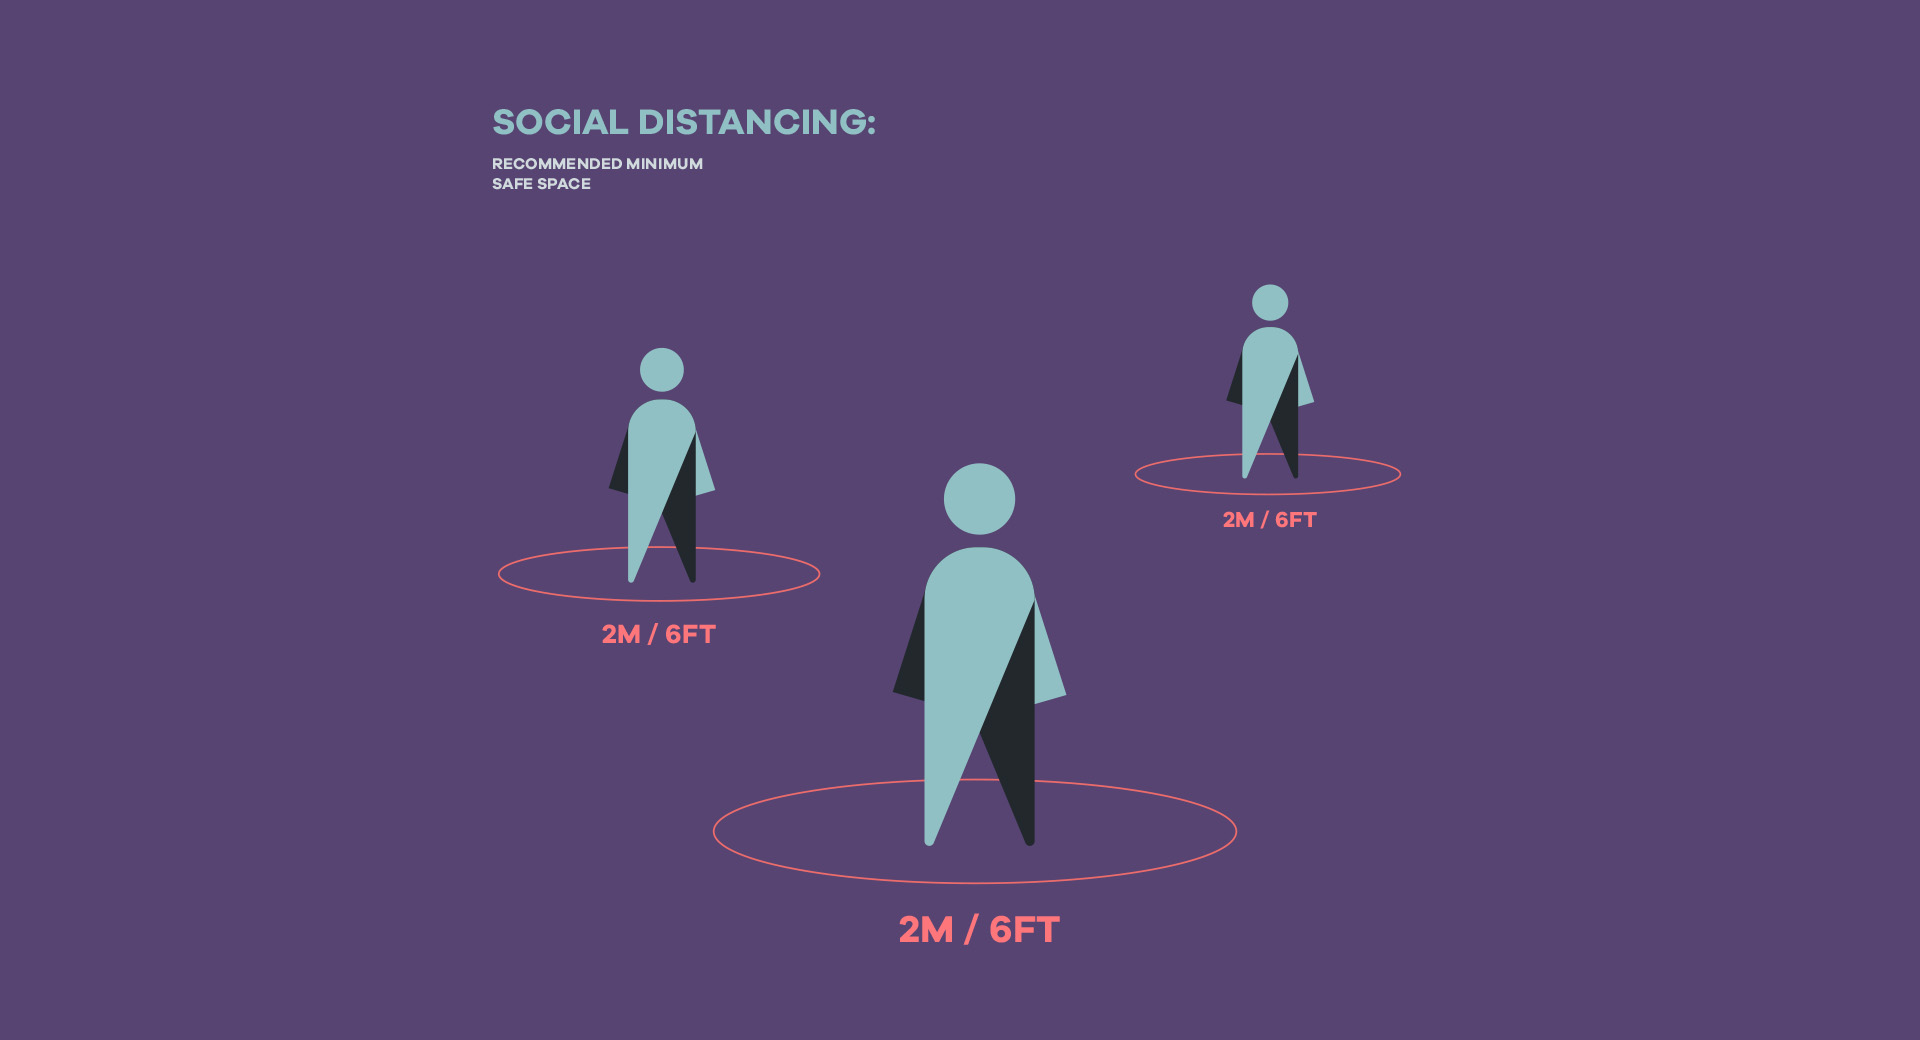
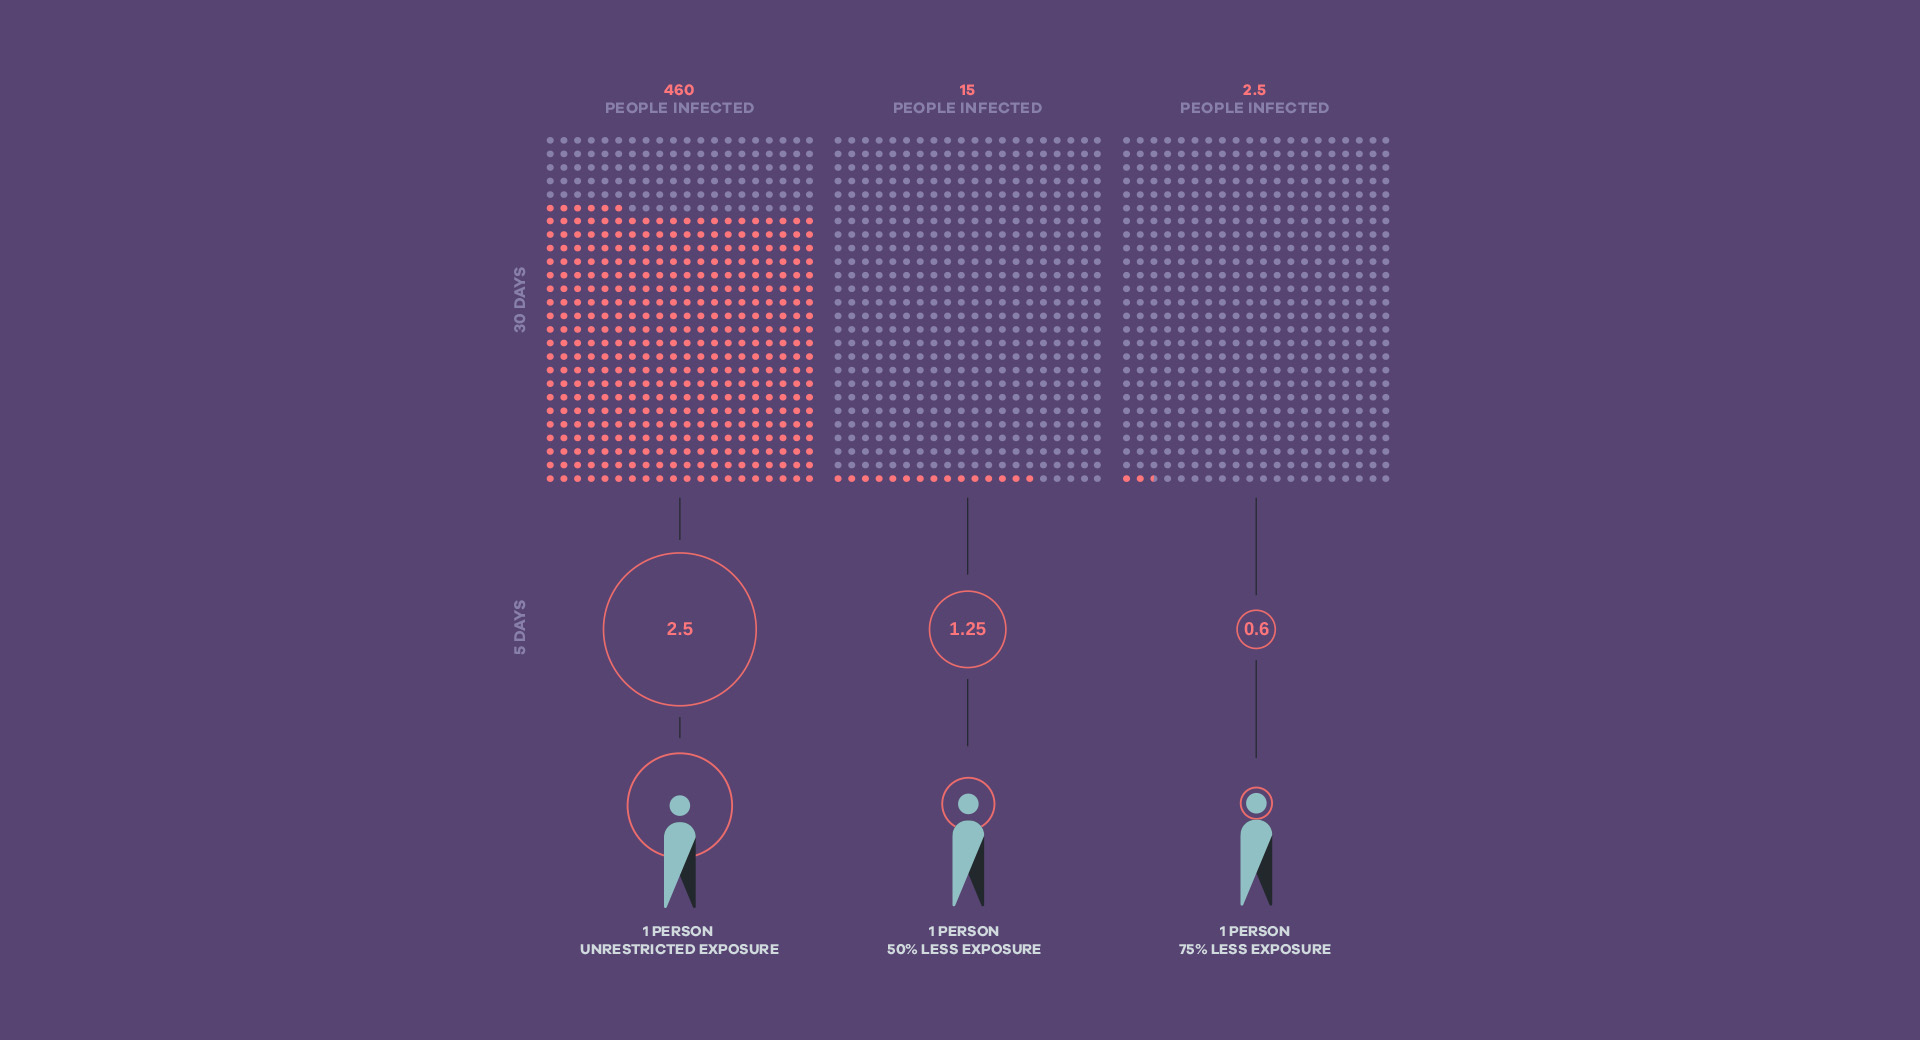
Covid Social Distancing Infographic
Infographic design highlighting how social distancing measures affect coronavirus transmission rates.

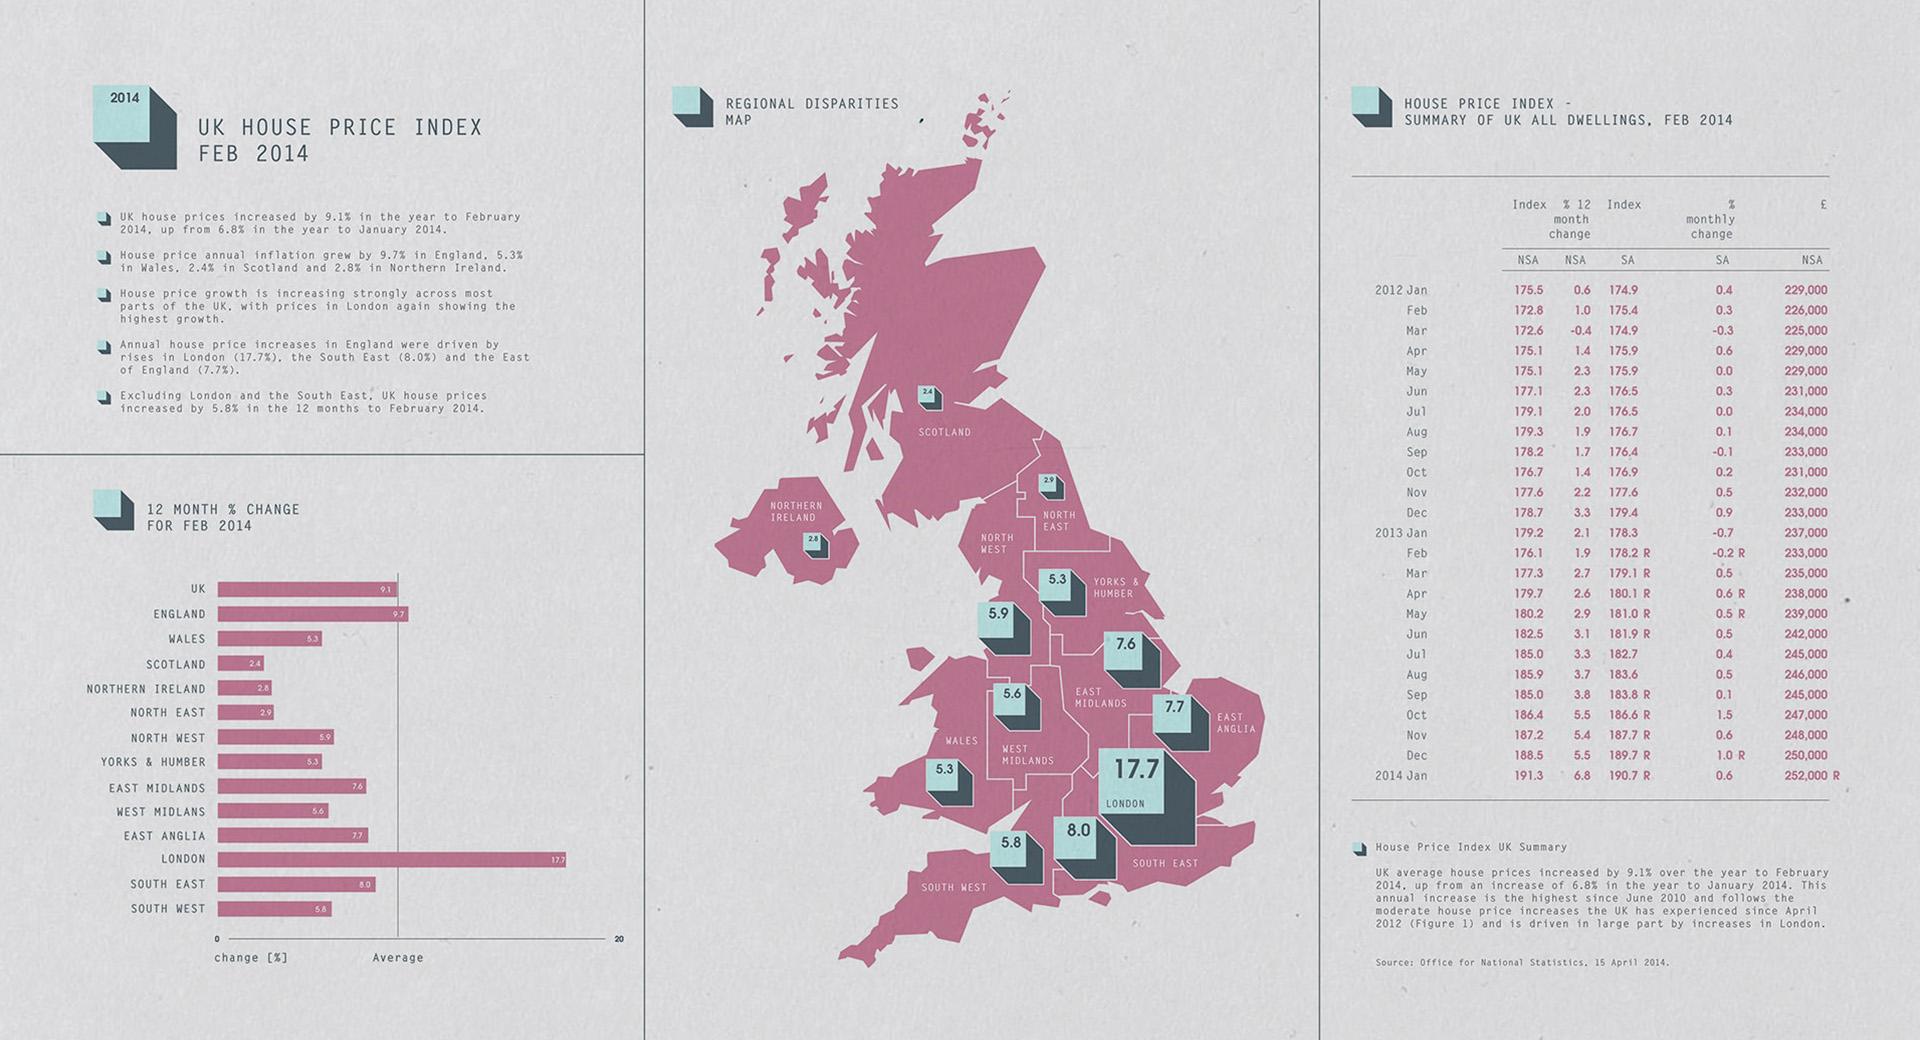
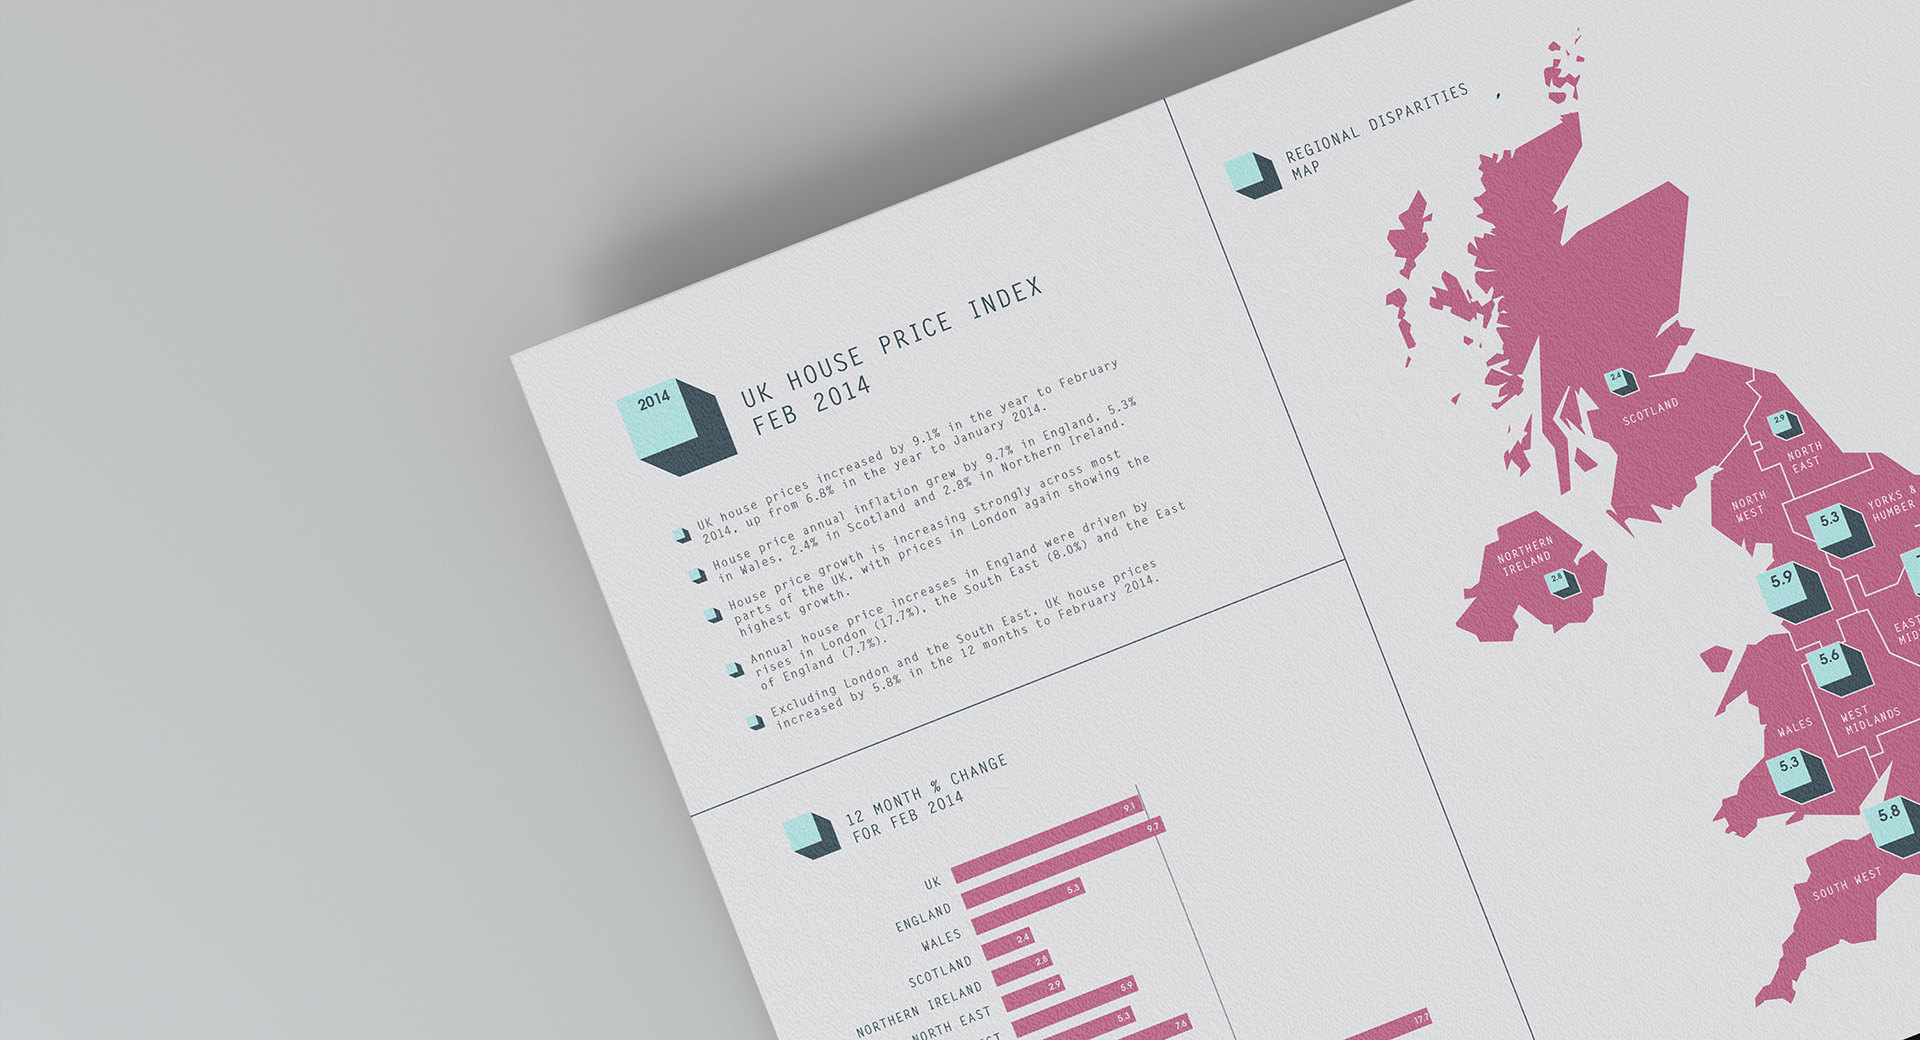
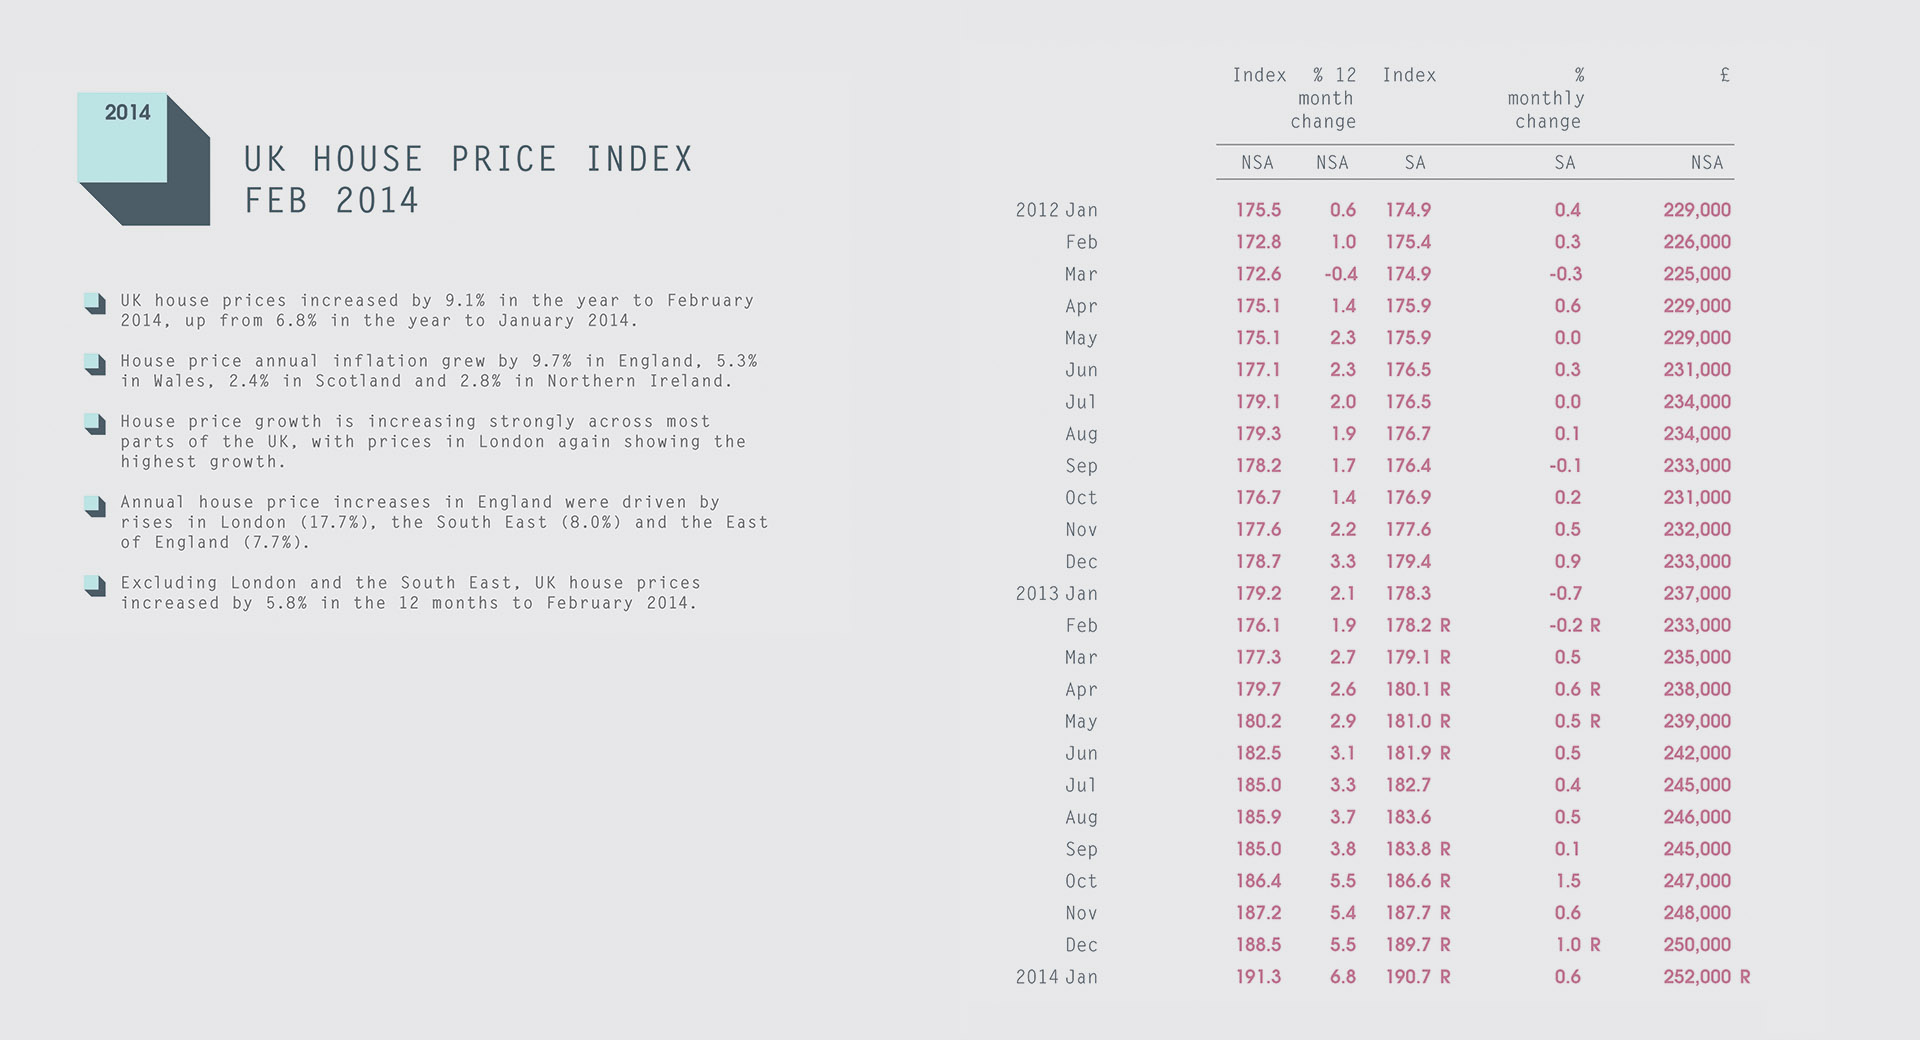
UK House Price Disparities Infographic
Graphic showing average UK house price increases for the year ending Feb 2014, and the regional disparity between the rises. Price changes also broken down into monthly increments. Based on data provided by the Office for National Statistics, 2014.
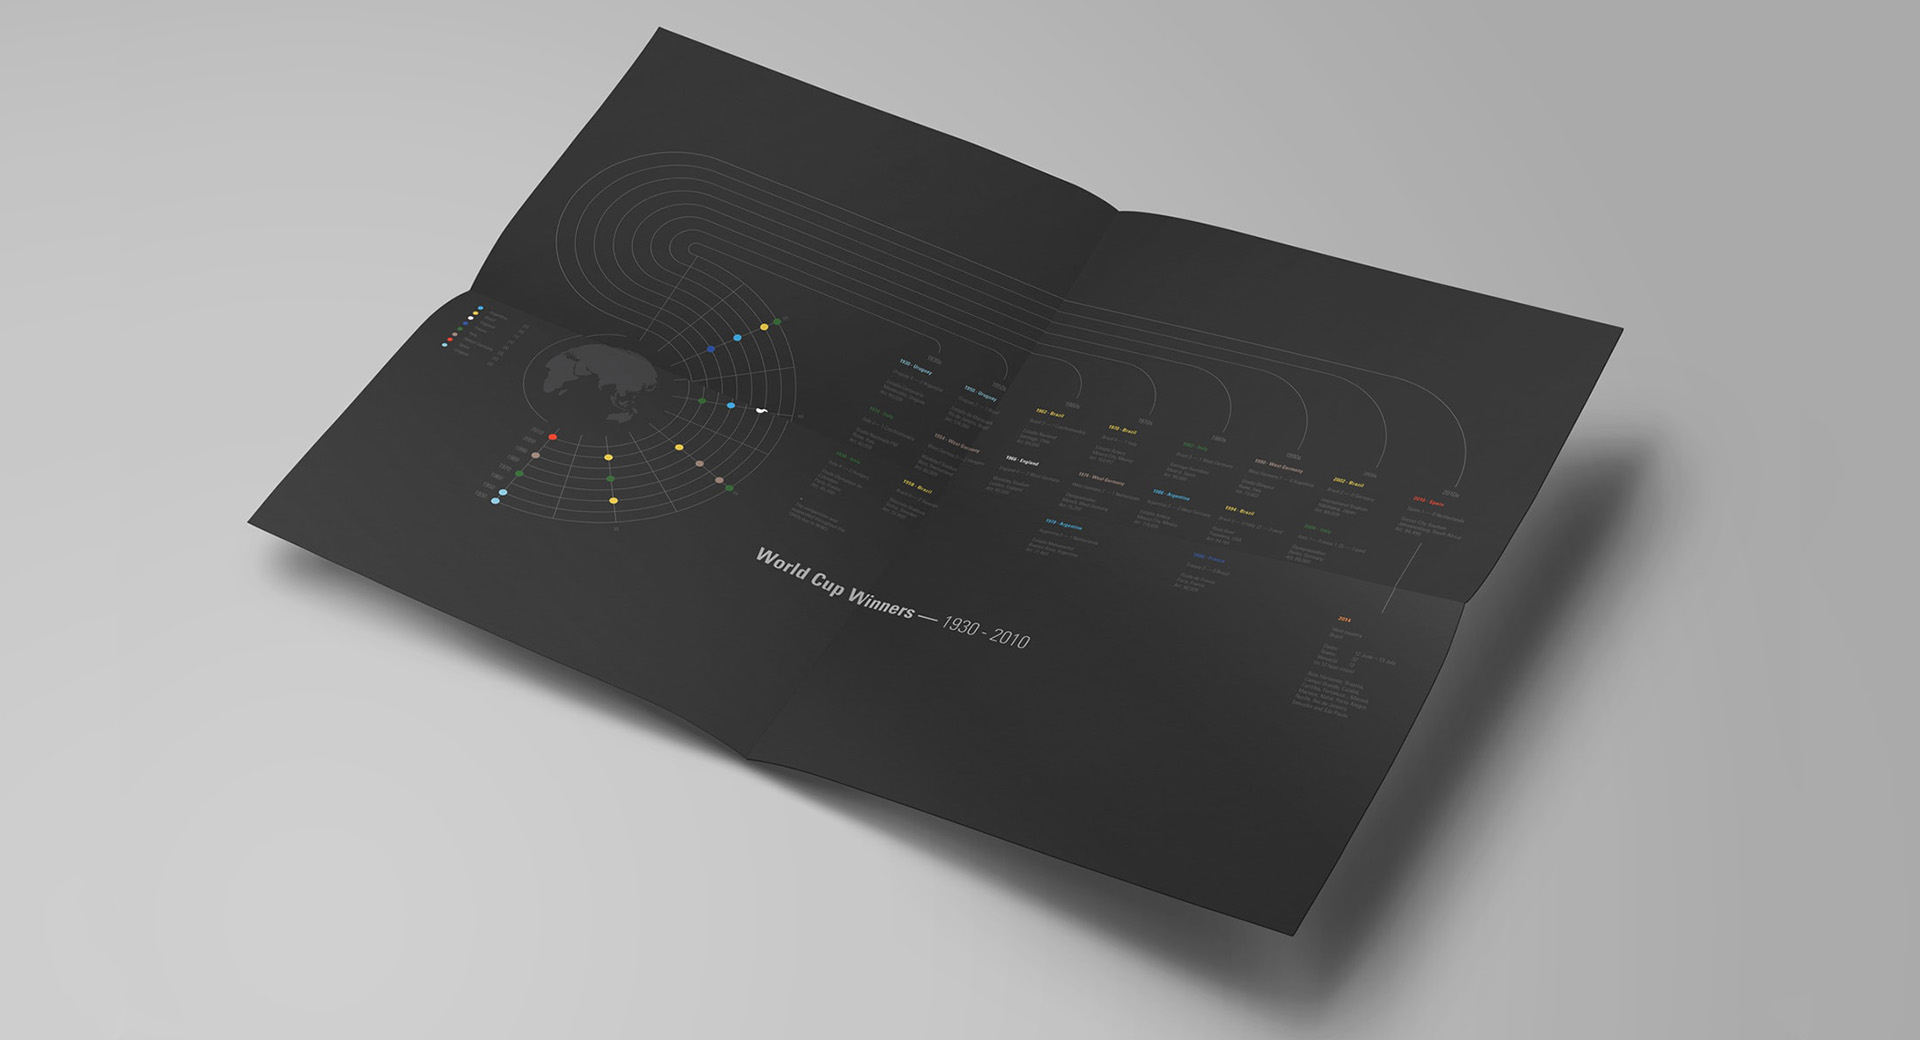
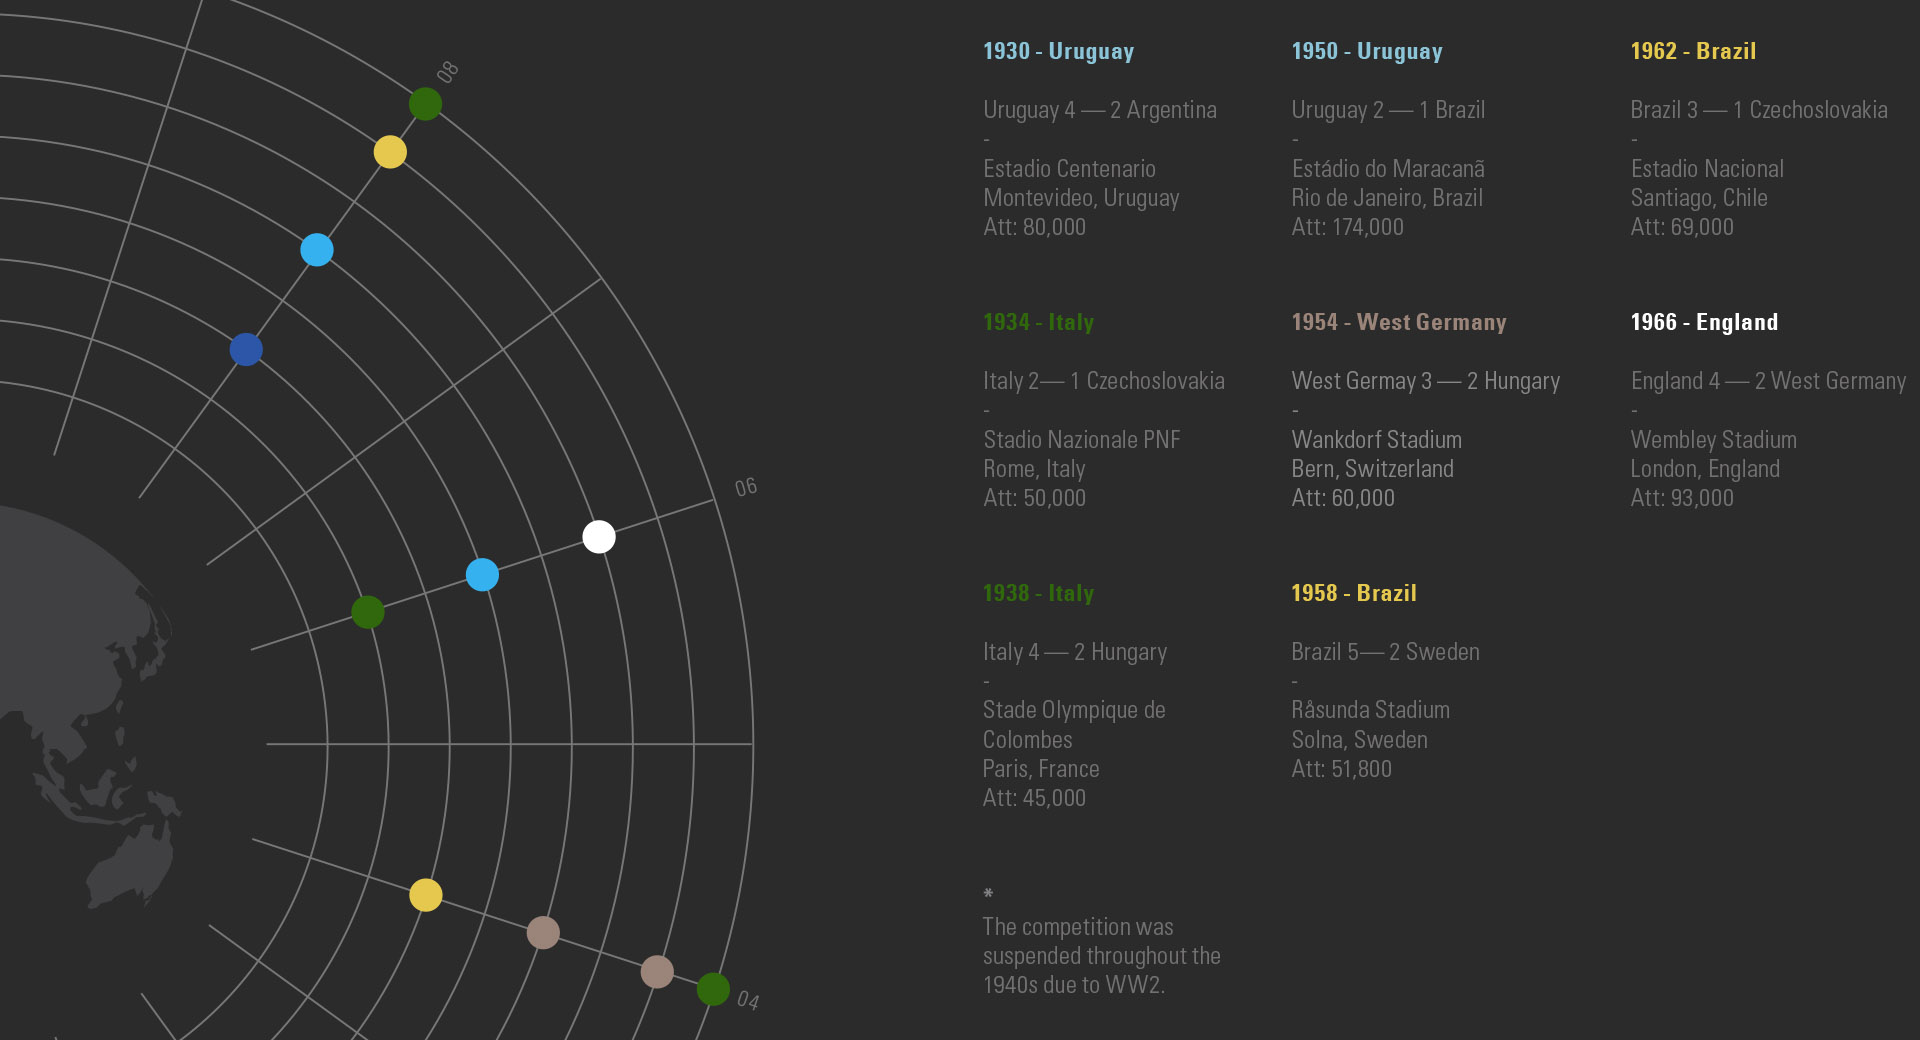
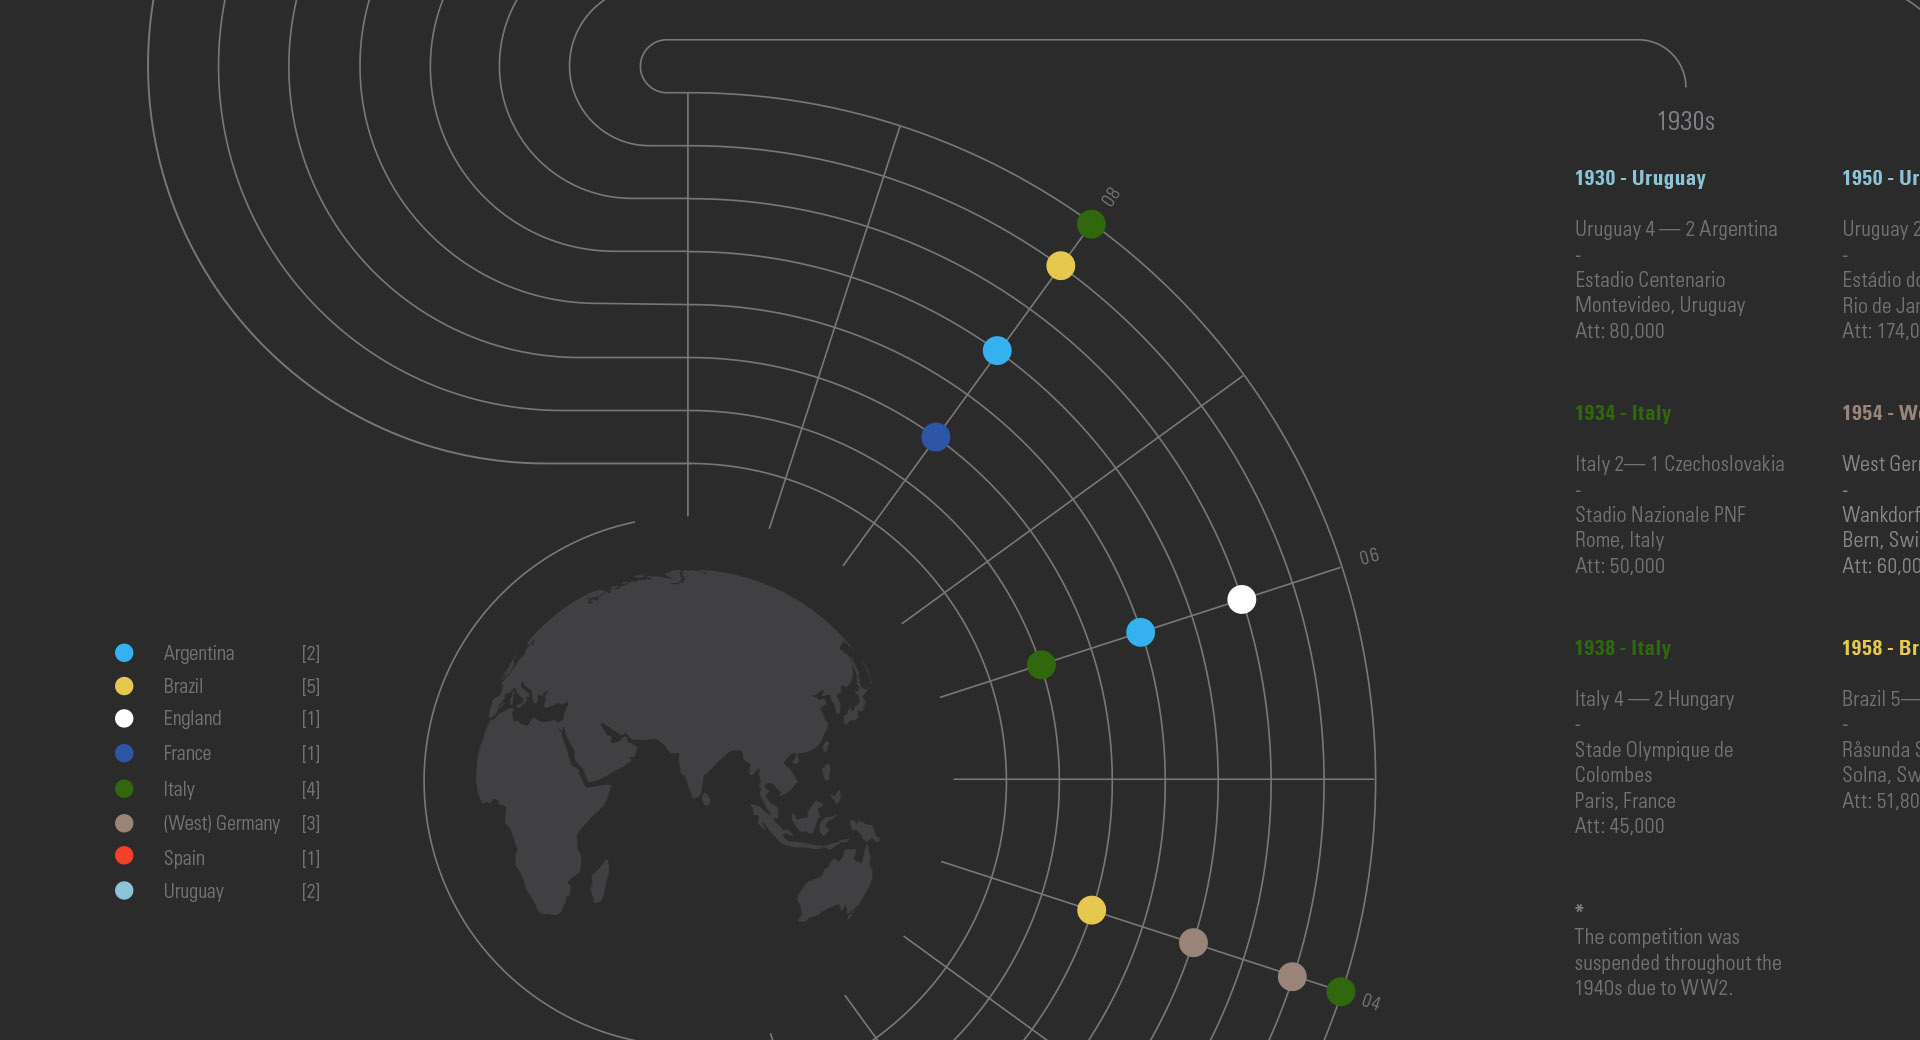
World Cup Winners Infographic
Timeline infographic showing past winners of the football world cup, who contested each final, host city and match attendance.

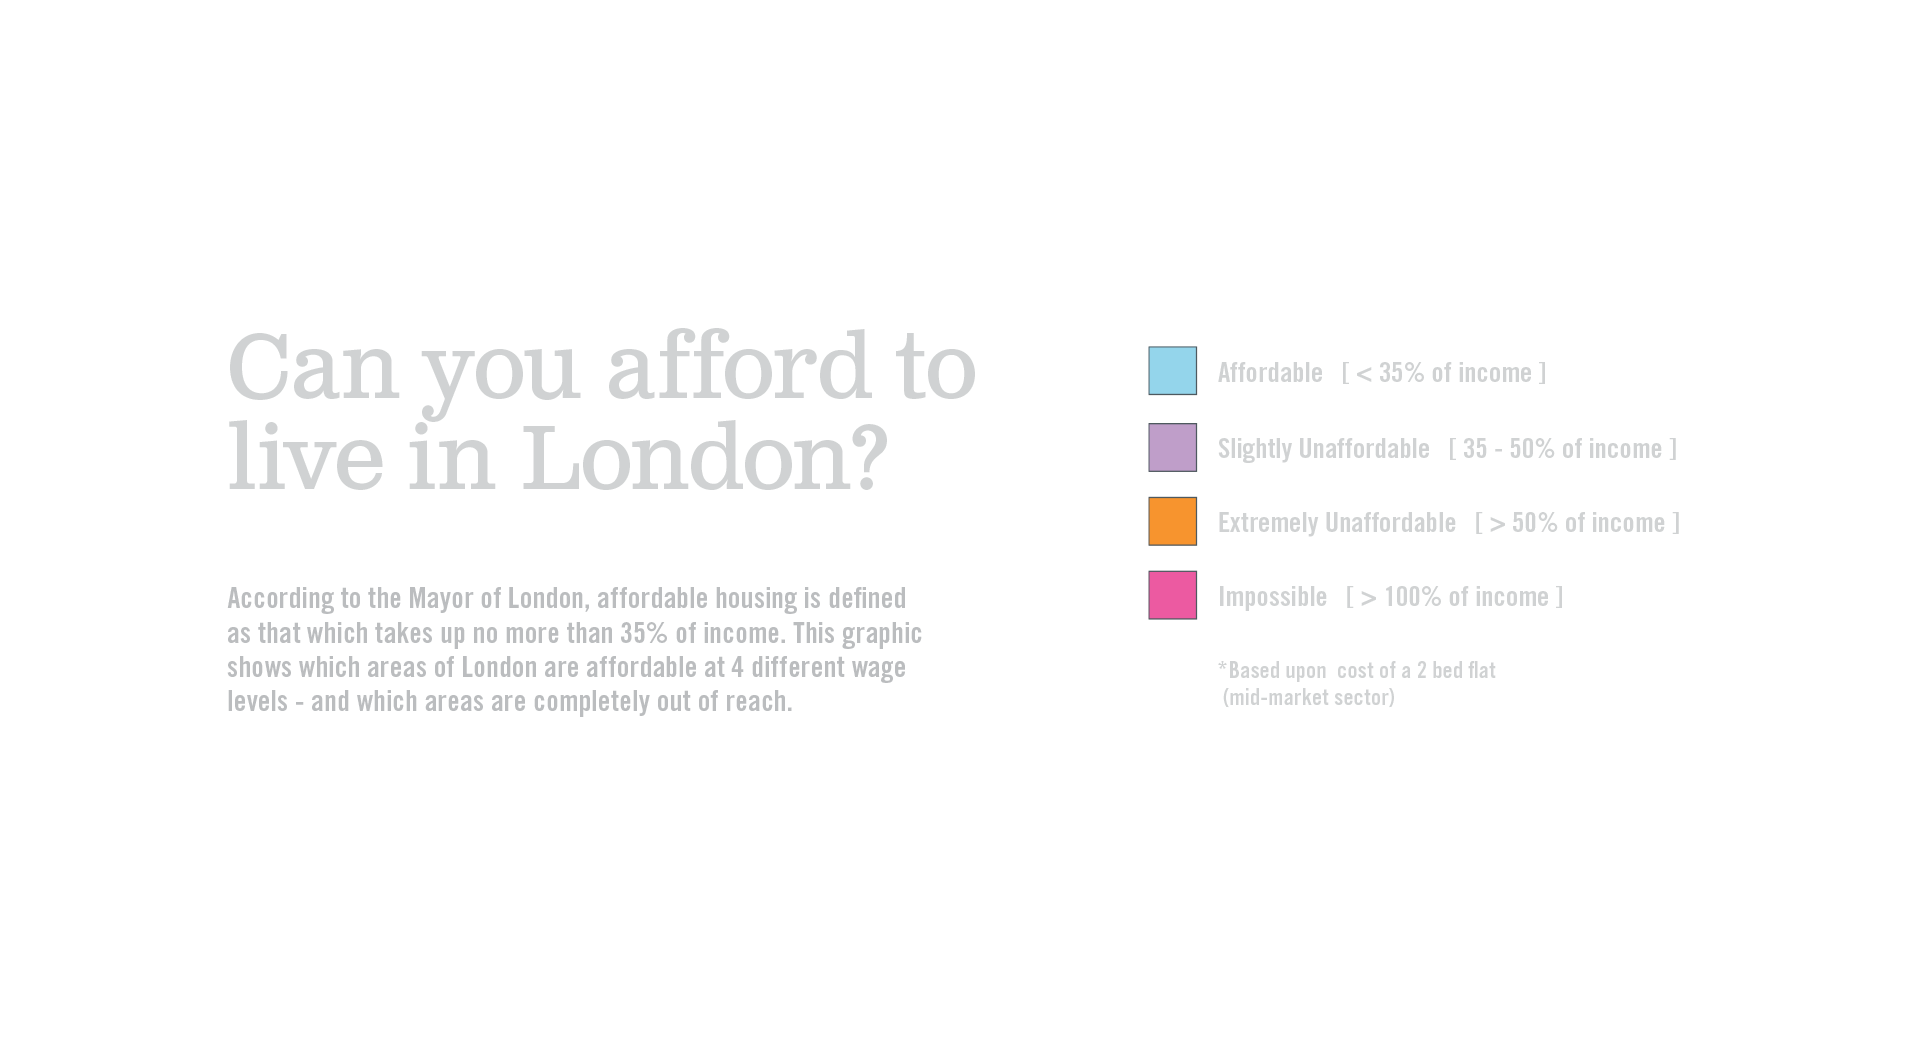
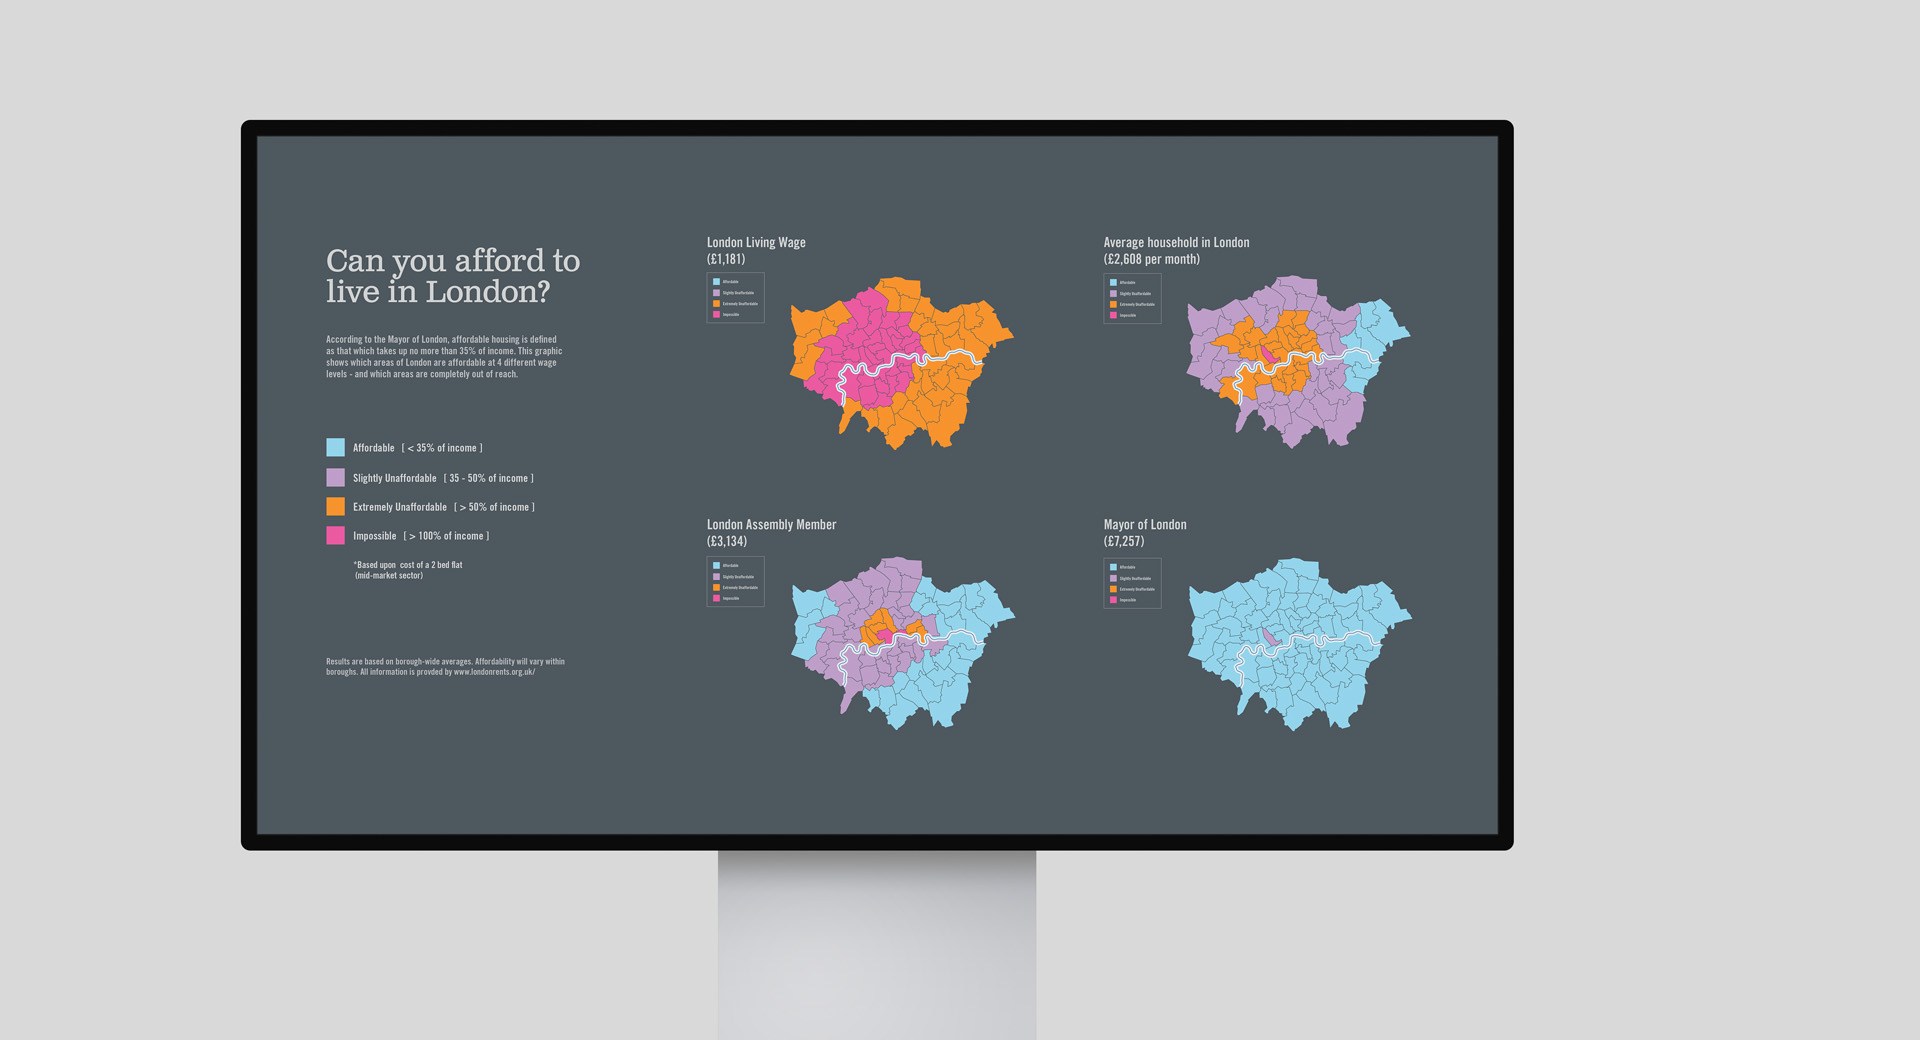
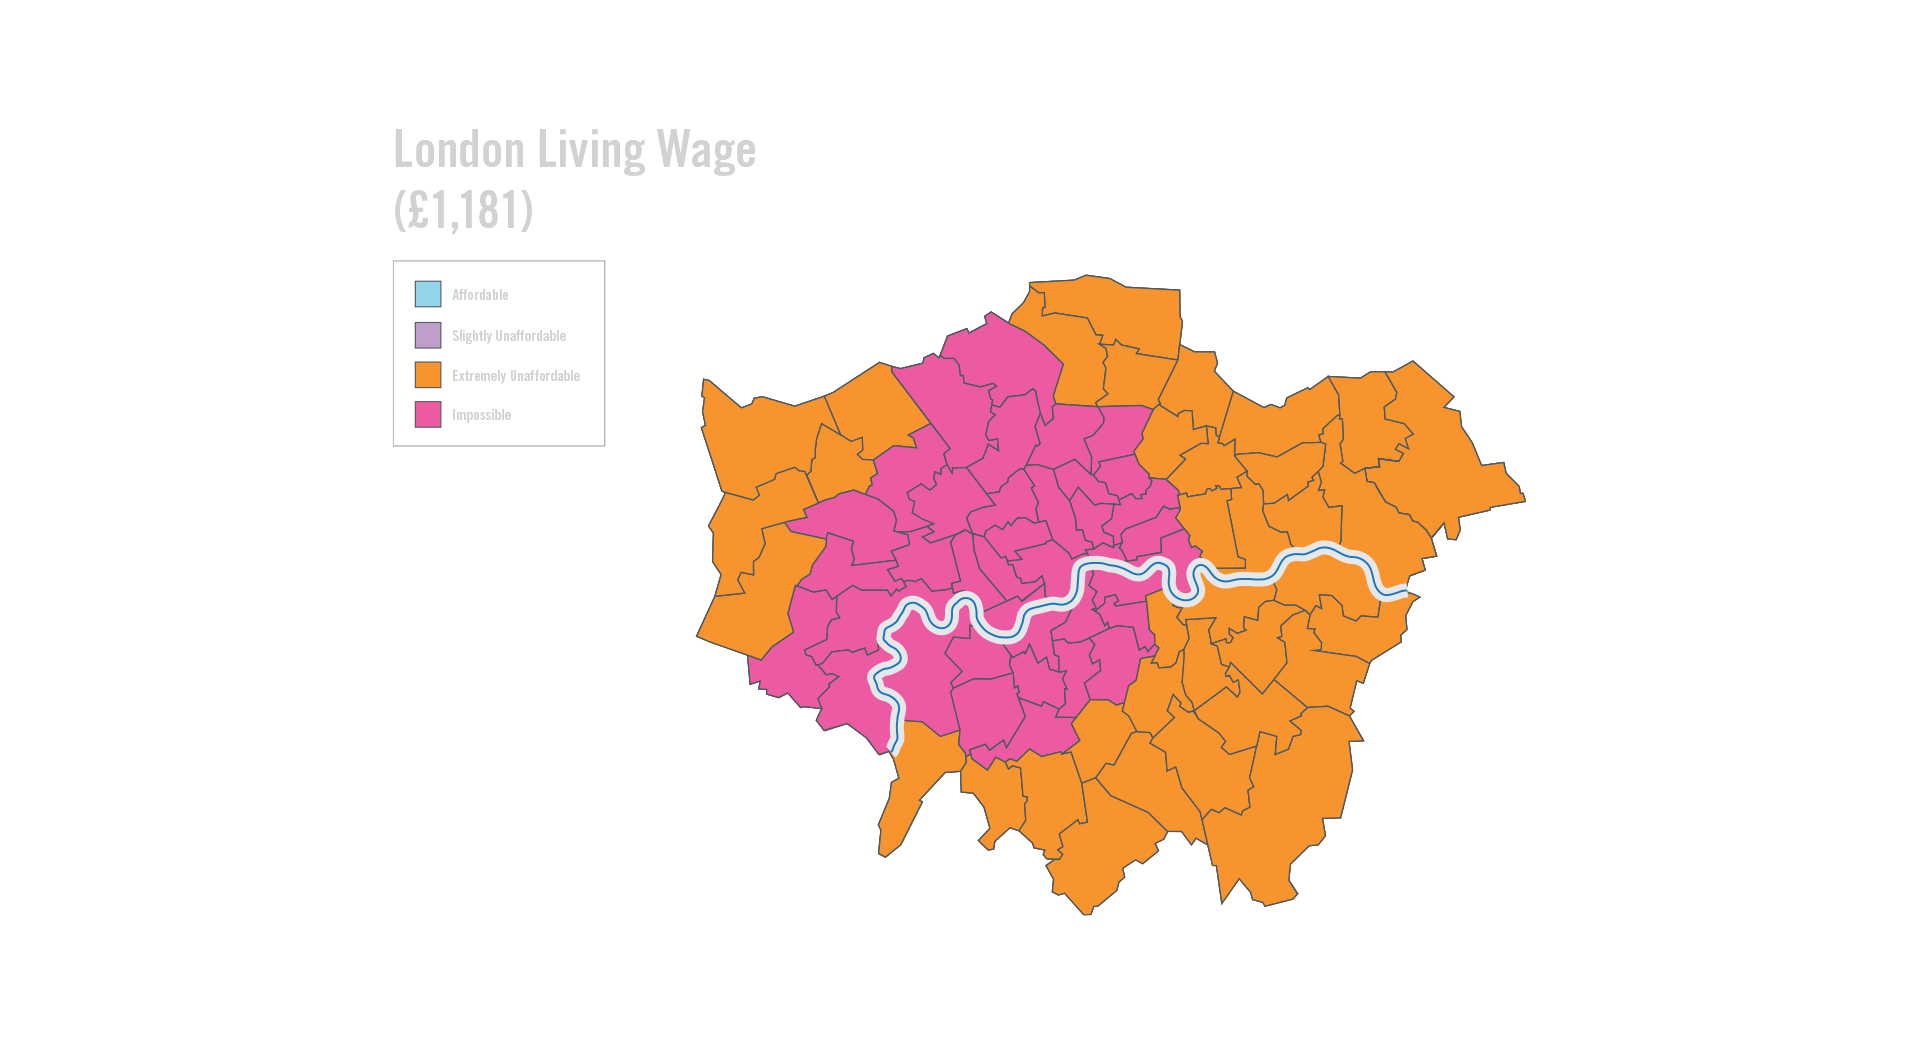
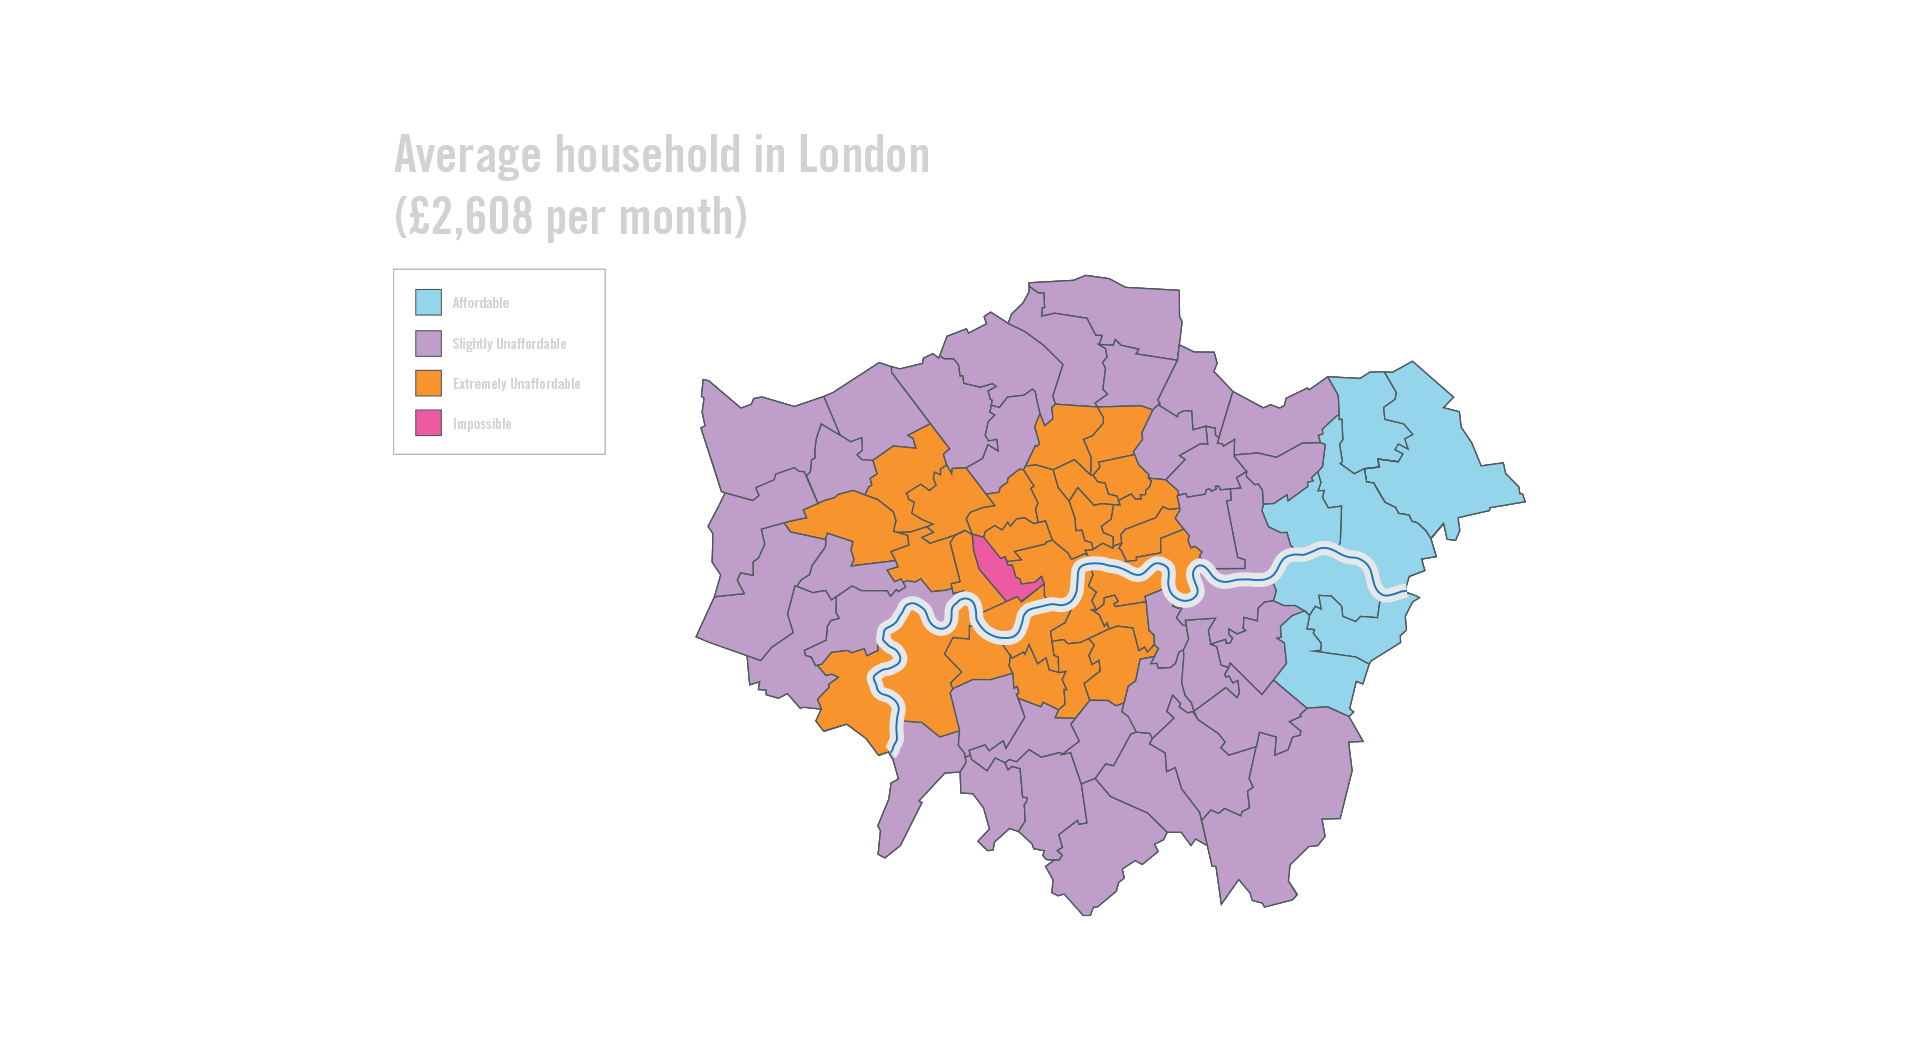
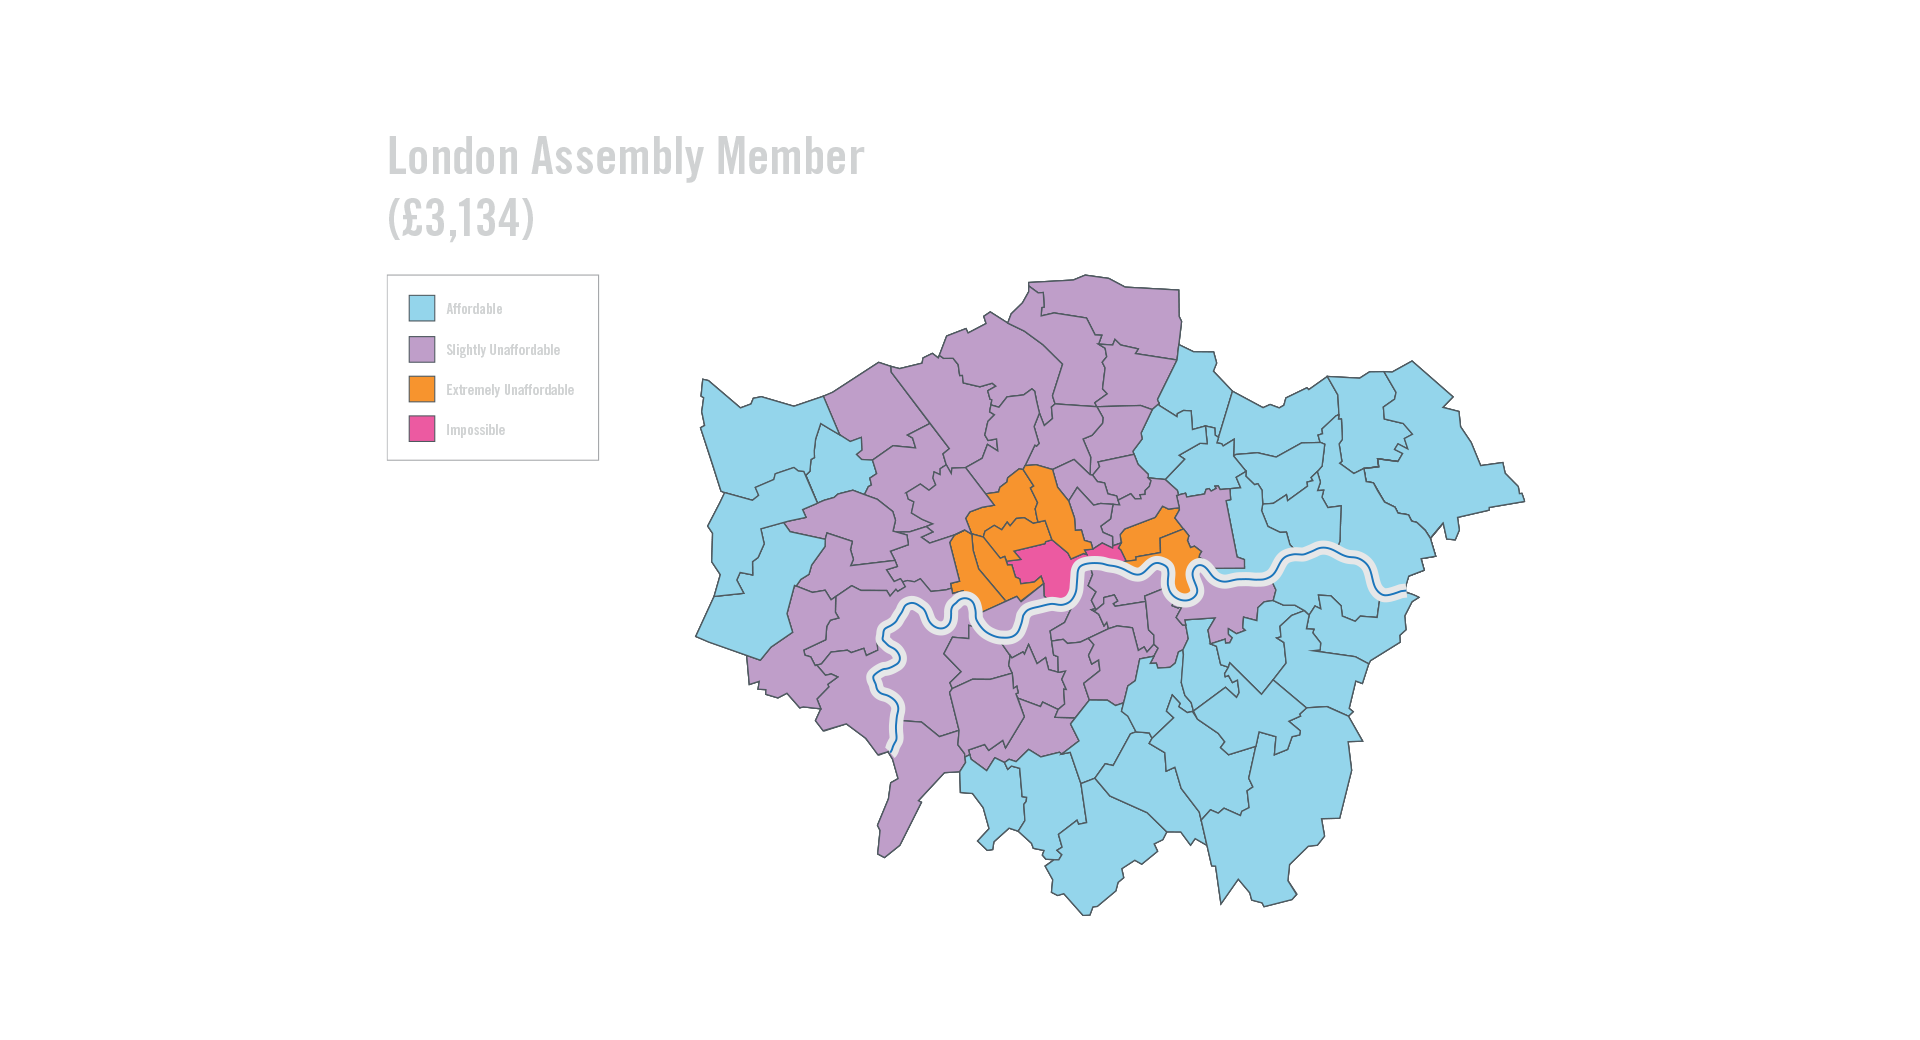
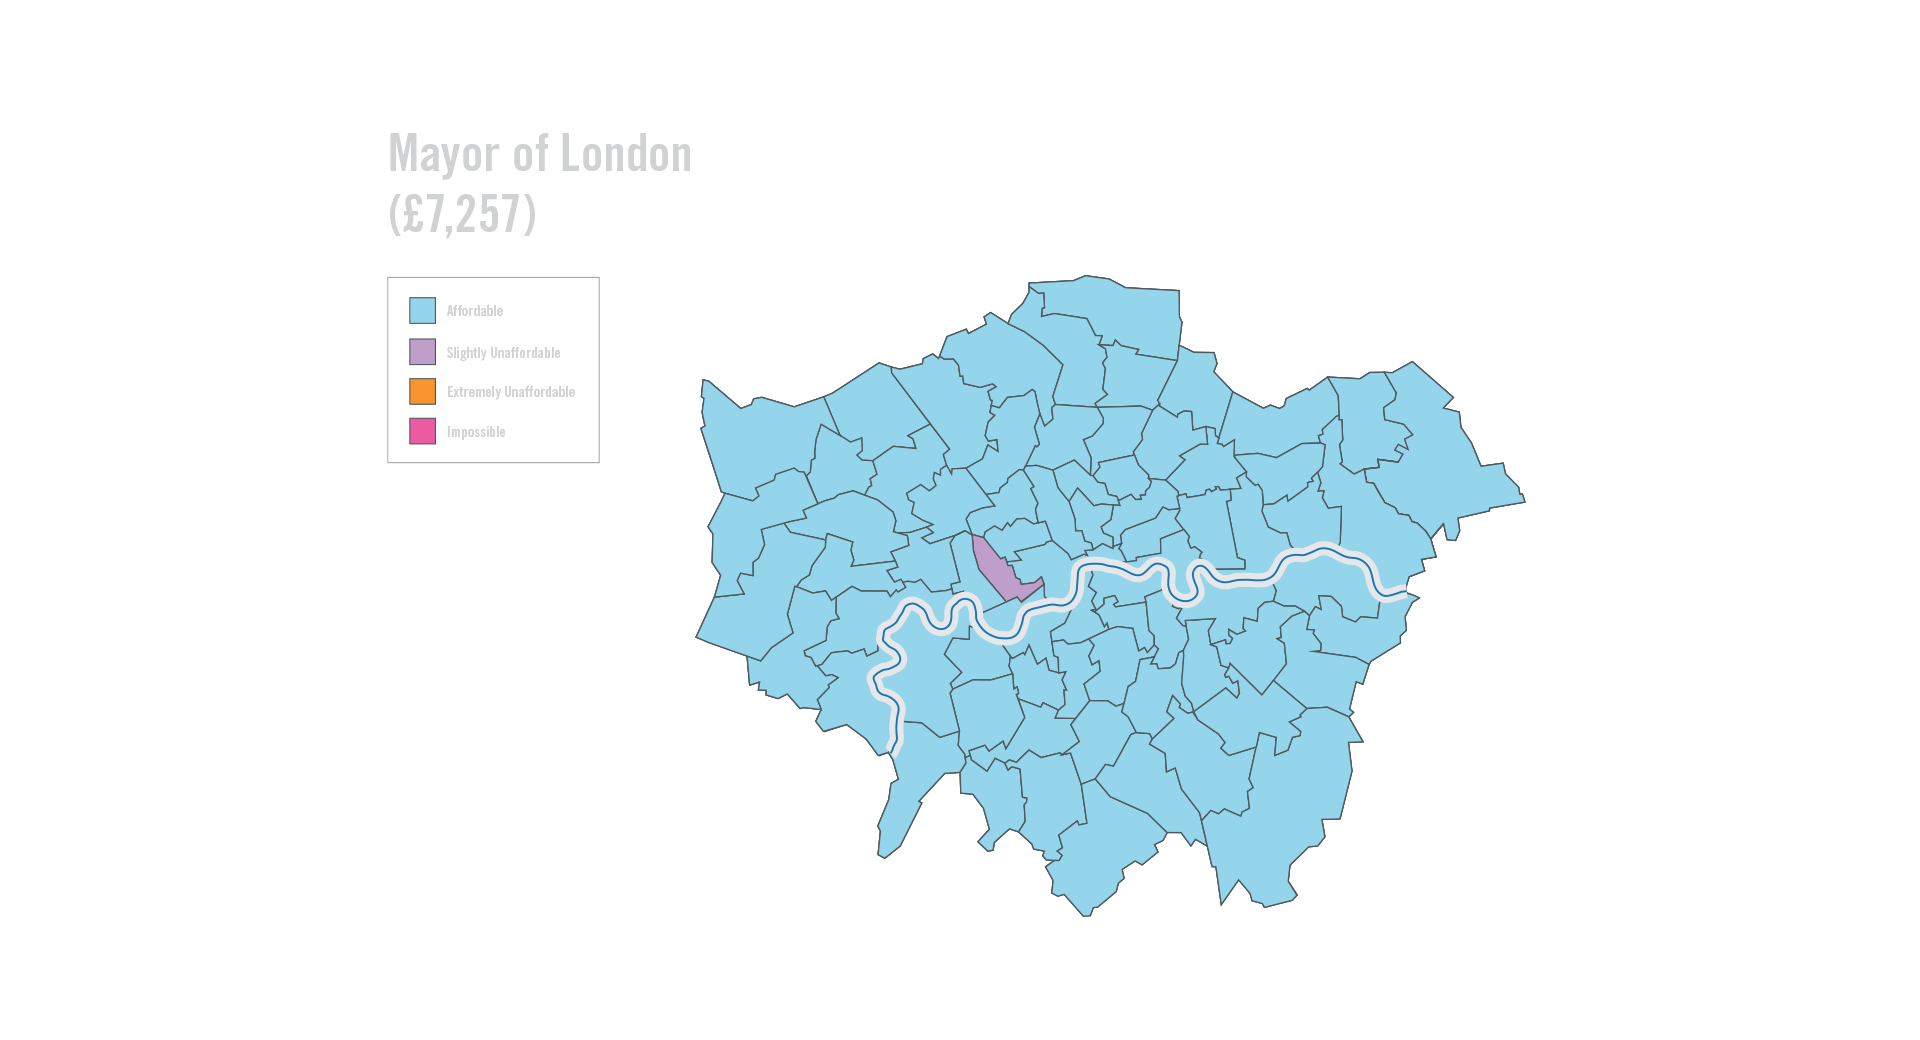
Can you afford to live in London?
According to the Mayor of London, affordable housing is defined as that which takes up no more than 35% of income. This graphic shows which areas of London are affordable at 4 different wage levels – and which areas are completely out of reach.